FLASH
30 July 2025
Exports in June expanded strongly, and the one-month delay in U.S. reciprocal tariffs has further supported the full-year export outlook
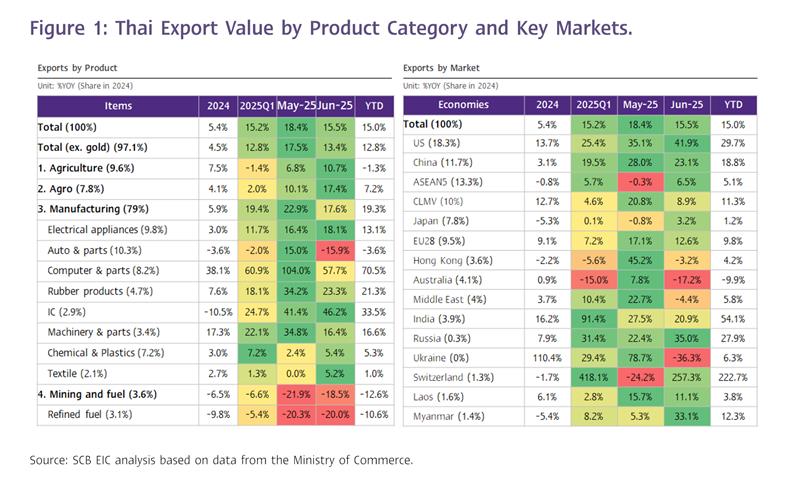
The value of Thai merchandise exports in June 2025 expanded by 15.5%YOY to USD 28,649.9 million
The value of Thai merchandise exports in June 2025 expanded by 15.5%YOY
to USD 28,649.9 million, compared to 18.4%YOY in the previous month. This was a slower pace than previously estimated (SCB EIC forecasted 17.1%, and the Reuters Poll median projected 18.7%). Seasonally adjusted export data declined by -0.9%MOM_SA from the previous month. Overall, Thai export value in the first half of this year grew by an average of 15% (Figure 1 and Figure 2).
June exports continued to be supported by multiple factors, though several product categories have started to show signs of slowing
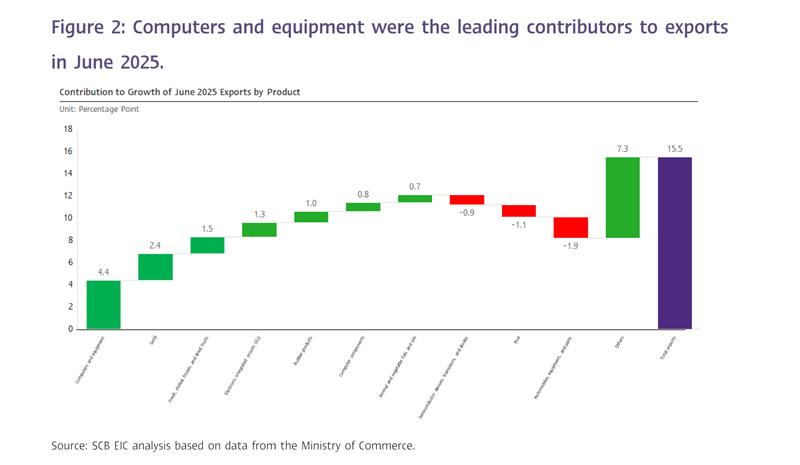
(1) The upcycle in computer products, equipment, and components remained a key driver, with this category expanding by 57.7%, albeit slowing from 104% in the previous month. Exports to the US surged by 118%, accelerating from 88.3% in the prior month, while exports to China decelerated to 122.8% from 311.6% previously. Meanwhile, other markets began to contract by -2.4%, following strong growth of 66.8% in the prior month. This product group contributed 5.5 percentage points to the overall Thai export growth of 15.5% this month (CTG).
(2) Front-loading to the U.S. ahead of the full impact of reciprocal tariffs drove a sharp export increase of 41.9%, up from 35.1% in the previous month. Notably, key electronic products not yet subject to additional U.S. tariffs continued to show strong growth: computers, equipment, and components rose by 118%; teleprinters, telephone sets, and parts by 9.4%; and electrical circuit boards by 36.9%. In contrast, exports of motor cars, parts, and accessories—already subject to a 25% product-specific tariff—edged down by -2.6% this month. Overall, exports to the U.S. contributed 7.5 percentage points to Thailand’s total export growth of 15.5% in June (CTG).
(3) Gold remained a key driver of export growth. Exports of unwrought gold continued to rise considerably by 115.6%, accelerating from 59.6% in the previous month. However, this marked a notable slowdown compared to 256% and 272.2% growth in April and March 2025, respectively. Switzerland was the main export market this month, with growth reaching as high as 421.5%. Exports of unwrought gold contributed 2.4 percentage points to Thailand’s total export growth of 15.5% this month (CTG). Meanwhile, the special boost from gold-platinum alloy exports to the Indian market—an important factor earlier this year—has clearly faded.
(4) Base effect – The export value in June 2024 was relatively low compared to other months and to the typical June average in the pre-COVID period. As a result, part of the high export growth in June 2025 can be attributed to the low base effect.
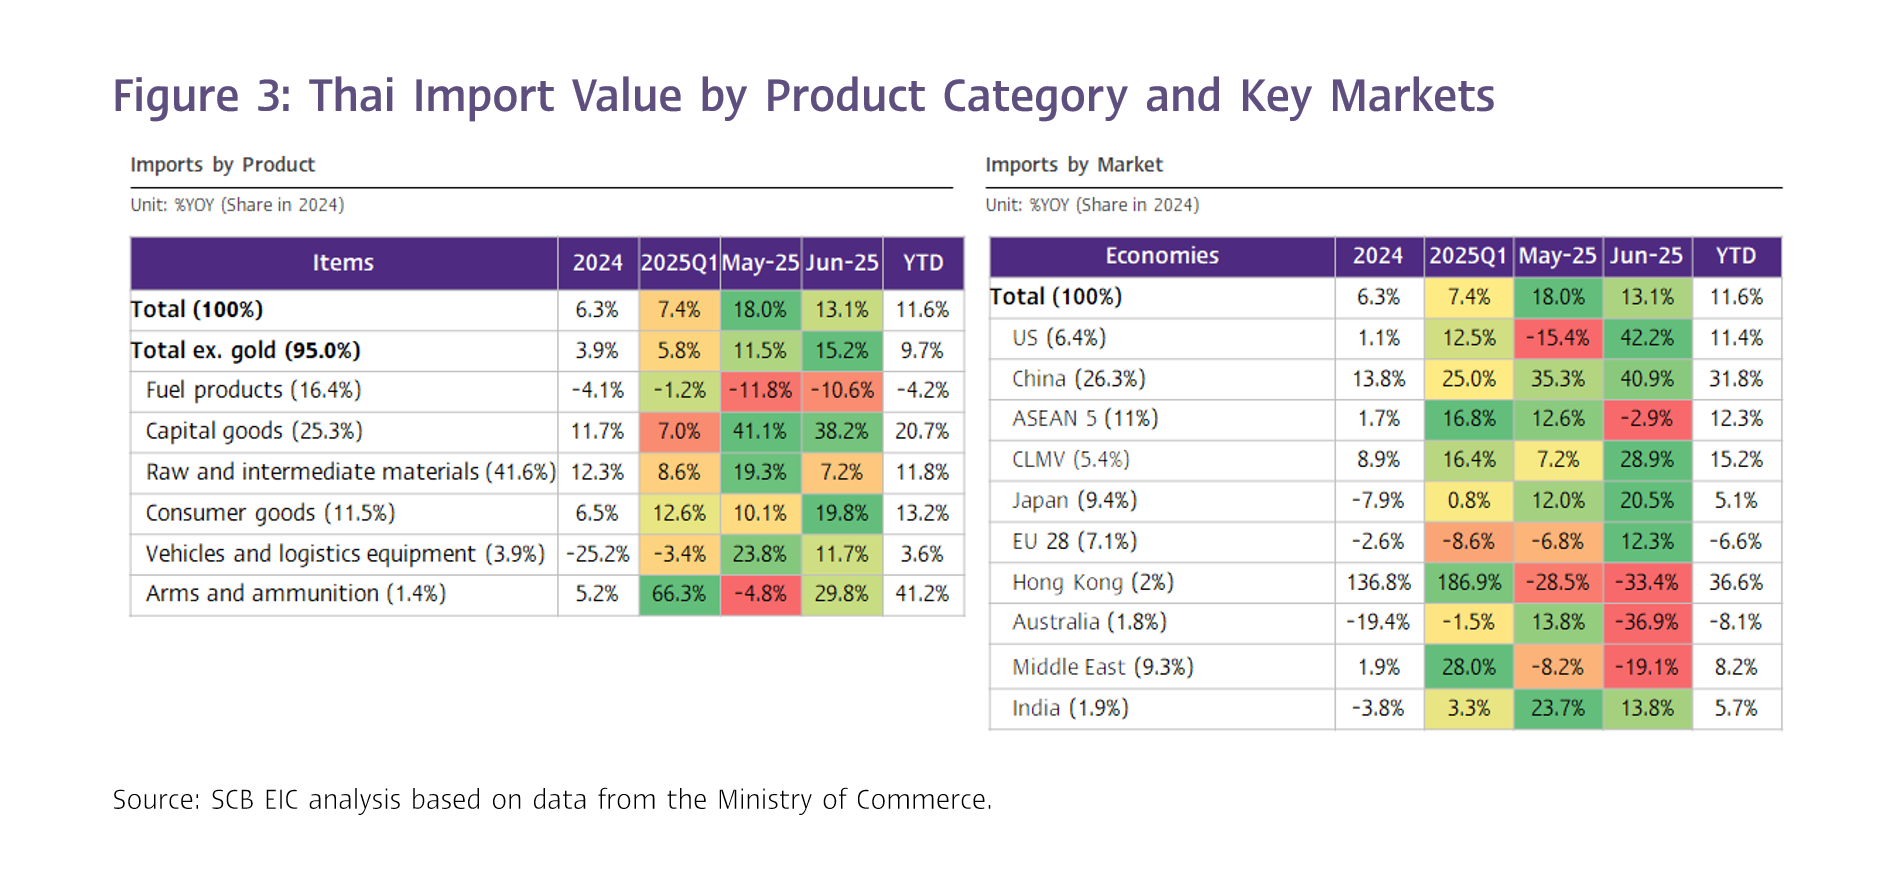
The value of merchandise imports slowed in line with the export value.
The value of merchandise imports in June stood at USD 27,588.2 million, expanding by 13.1%, down from 18.0% in the previous month. This marked a sharper-than-expected slowdown (SCB EIC forecasted 14.5% and the Reuters Poll median projected 17.8%). Capital goods were the main contributor, growing by as much as 38.2%—particularly imports from China, which rose by 48.7%, up from 45.9% in the prior month, accounting for 48.6% of Thailand’s total capital goods imports this month. Imports of arms and ammunition, consumer goods, vehicles and logistics equipment, and raw and intermediate materials (including gold) expanded by 29.8%, 19.8%, 11.7%, and 7.2%, respectively. Meanwhile, imports of fuel products continued to decline by -10.6%. (Figure 3)
Thailand’s trade balance (customs basis) recorded a surplus of USD 1,061.7 million this month, close to SCB EIC’s estimate of USD 1,200 million and the Reuters Poll median of USD 600 million. For the first half of 2025, the cumulative trade balance registered a deficit of USD -62.2 million.
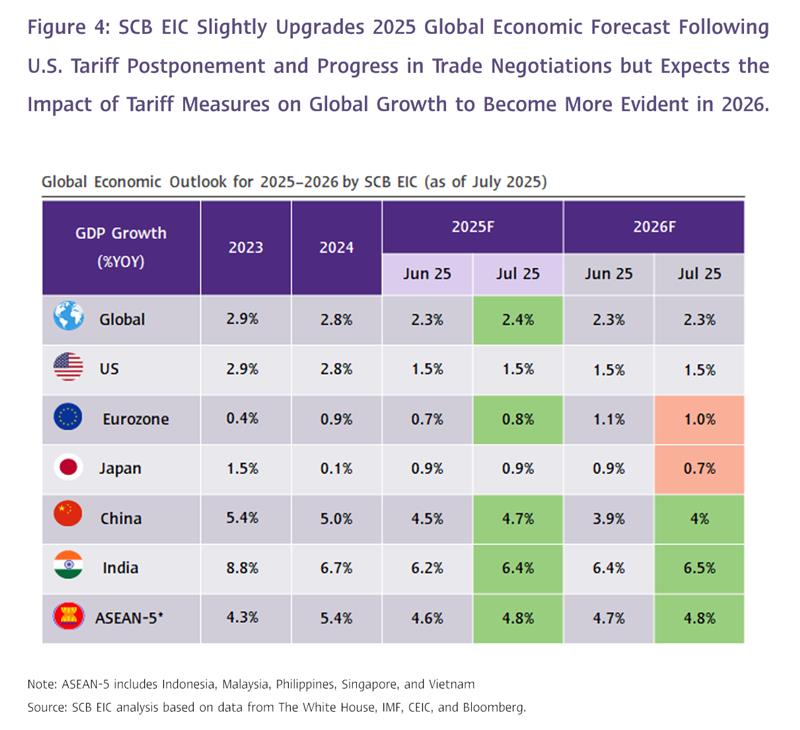
SCB EIC assesses that strong front-loaded exports in the first half of the year, combined with a one-month delay in Trump’s retaliatory tariffs, have supported this year’s export outlook. However, next year faces elevated risks of sharp contraction.
The outlook for Thai merchandise export value in 2025 has improved, shifting from flat growth to modest expansion. This revision reflects strong Q2 export performance, driven by accelerated production ahead of U.S. reciprocal tariffs (front-loading). The one-month delay of the tariff hike to August 1 has also slightly lifted the global economic outlook for this year from 2.3% to 2.4% (Figure 4).
Nevertheless, Thai exports in late 2025 and the overall outlook for 2026 remain at risk of contraction due to the increasing impact of U.S. tariff measures. These risks are expected to materialize more clearly once the U.S. fully implements both the reciprocal and specific tariffs as announced. Moreover, key drivers of export growth seen in the first half of 2025—such as the electronics upcycle, front-loaded shipments ahead of U.S. tariff hikes, and the special factor from gold exports—are gradually dissipating.
Special Highlight (1): Only six countries have successfully reached trade agreements with the United States.
After the United States postponed the implementation of reciprocal tariffs for over 100 days, many countries have revised and submitted various proposals to reach trade agreements with the U.S. before the August 1 deadline. Nevertheless, as of now, only six countries have successfully reached agreements with the United States, namely:
Non-ASEAN countries.
· United Kingdom: The United States agreed to maintain the reciprocal tariff rate at 10% but reduce the product-specific tariff on the first 100,000 cars to 10%, down from 25%. It also granted exemptions for certain aerospace products and established low-tariff quotas for steel and aluminum exports to the U.S. In return, the United Kingdom agreed to lower non-tariff barriers, expand market access for U.S. goods such as beef and ethanol, comply with U.S. supply chain security standards, and participate in structured negotiations in key sectors—namely automotive, aerospace, steel, and aluminum—to enhance transparency and alignment with U.S. regulations.
· China: The United States temporarily reduced reciprocal tariffs to 30% (down from 145%). However, when including the previous 25% tariff under Trump 1.0, the total tariff increase on Chinese goods remains at 55%. The U.S. also lowered the De Minimis tariff rate on small-value imports from China to 54% (from 120%) and eased certain trade barriers previously imposed on China. In return, China imposed a 10% tariff on U.S. goods and slightly relaxed export controls on rare earth elements and magnets.
· Japan: The United States agreed to reduce reciprocal tariffs to 15% (from 25%) and may also lower the product-specific tariff on Japanese automobiles to 15% (as announced by Japanese authorities, though not yet confirmed by the U.S.). In return, Japan agreed to enhance market access for certain U.S. goods, such as trucks and rice, and committed to increasing its investment in the United States by USD 550 billion.
ASEAN countries.
· Vietnam: The United States reduced reciprocal tariffs to 20% (down from 46%) and imposed a 40% tariff on goods from other countries exported via Vietnam, aimed at preventing transshipment—particularly from China. In return, Vietnam agreed to fully open its market to the U.S. by lowering tariffs to 0% and reducing non-tariff barriers (as announced by the U.S.). Vietnam, however, is continuing negotiations to seek a further reduction of reciprocal tariffs below 20%.
· Indonesia: The United States reduced reciprocal tariffs to 19% (down from 32%). For goods from high-tariff countries re-exported through Indonesia, the U.S. will impose a 19% tariff plus the original country’s tariff rate. In return, Indonesia agreed to open nearly its entire market to the U.S. (99%, excluding pork and alcohol due to religious principles), by reducing tariffs to 0% and lowering several key non-tariff barriers. Indonesia also agreed to recognize certain U.S. product regulatory standards and to improve labor standards.
· Philippines: The United States reduced reciprocal tariffs to 19% (down from 20%). In return, the Philippines opened its market to the U.S. by lowering tariffs to 0%. Additionally, the U.S. and the Philippines announced an agreement to expand military cooperation between the two countries.
Special Highlight (2): Progress of Thailand’s Trade Negotiations and the Implications of Market Liberalization.
The fact that Vietnam, Indonesia, and the Philippines successfully reached trade agreements with the United States ahead of others—by granting full market access to U.S. goods in exchange for lower reciprocal tariffs, and allowing the U.S. to impose transshipment tariffs on products with low or limited domestic supply chain content—has established a new benchmark for negotiations between the U.S. and other ASEAN countries. This development may pressure Thailand to expedite trade talks with the U.S. and offer more favorable terms in order to secure similar tariff rate, which would help maintain the price competitiveness of Thai exports in the U.S. market.
According to recent statements from Thailand’s negotiation team, the country has submitted a revised proposal offering broader market liberalization for U.S. goods than in the initial round—raising the proposed coverage from 64% to approximately 90% of imports from the U.S. The remaining share is expected to include key agricultural products, which could have wide-ranging impacts on domestic producers and employment. This expanded offer aims to negotiate a reduction in the reciprocal tariff rate—initially set by the U.S. at up to 36%—to a range of 18%–20%, bringing it in line with, or even below, competitor levels.
The decision by U.S. trading partners—particularly ASEAN countries—to open their markets to U.S. goods is likely to significantly impact Thai exports through the following channel:
1) Thailand’s competitiveness in key export markets such as the ASEAN region: If ASEAN countries adopt the new negotiation benchmark with the U.S., the influx of U.S. goods into the region is expected to increase, compounding the existing issue of Chinese product oversupply (twin influx). This will likely exert downward pressure on regional exports, which could severely impact Thailand’s export sector, given that ASEAN accounted for as much as 23.3% of total Thai export value in 2024. The agricultural and domestic manufacturing sectors are also likely to be affected as they increasingly lose competitiveness against both Chinese and U.S. products.
2) Impact on international relations with China: If transshipment agreements between ASEAN countries and the United States negatively affect China’s economy, this may prompt China to implement retaliatory tariffs. Such a development would pose a downside risk to the export sectors of both ASEAN and Thailand, given that China is also a major trading partner for Thailand—accounting for approximately 11.7% of Thailand’s total export value.
SCB EIC believes that if Thailand liberalizes its market for the United States, it may face a larger influx of U.S. goods compared to other ASEAN countries, due to the following reasons:
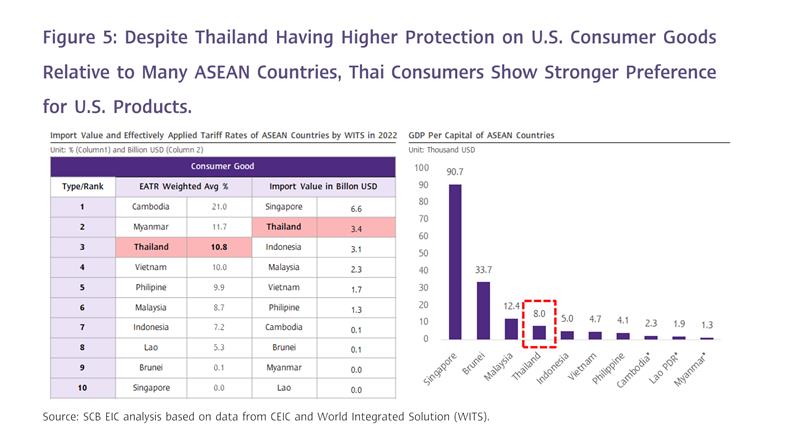
1. Thai consumers currently exhibit stronger demand for U.S. goods than many other ASEAN countries. Although Thailand maintains higher import tariffs to protect its domestic consumer goods market—ranking 4th highest in ASEAN in terms of Effective Applied Tariff Rate (EATR) on U.S. consumer goods—it is the 2nd largest importer of U.S. consumer goods in the region. This suggests that even with relatively high tariff protection, demand remains strong. One contributing factor may be Thailand’s relatively high per capita income, which also ranks 4th in the region. (Figure 5)
2. Thailand currently maintains higher levels of domestic market protection compared to many ASEAN countries. When comparing the Effective Applied Tariff Rate (EATR) on overall imports, by product category, and by product group across ASEAN nations for goods imported from the U.S., Thailand imposes higher tariffs than several of its regional peers. This is evident from Figures 6 and 7.
· For total imports, Thailand imposes the second-highest weighted average EATR on U.S. goods in ASEAN, at 6.2%, following Cambodia at 12.9%. The ASEAN average excluding Thailand stands at 3.9%.
· By product category, Thailand imposes a higher EATR on U.S. goods than the ASEAN average (excluding Thailand) in three out of four categories. The only exception is raw materials, for which Thailand applies a lower EATR than the regional average.
· By product group, Thailand imposes a higher EATR on U.S. goods than the ASEAN average (excluding Thailand) in 9 out of 16 product groups—especially for agricultural products, which the U.S. is pressing Thailand to liberalize. For instance, Thailand’s EATR on U.S. vegetables and meats is as high as 38% and 44.3%, respectively, with maximum tariff rates reaching up to 218% for certain items. In comparison, the ASEAN average EATR (excluding Thailand) on U.S. vegetables and meats stands at just 3.1% and 4.8%, respectively, with a maximum tariff rate of 107%.
![trade-en-01.jpg]()
![trade-en-02.jpg]()
![trade-en-03.png]()
![trade-en-04.jpg]()
![trade-en-05.jpg]()
to USD 28,649.9 million, compared to 18.4%YOY in the previous month. This was a slower pace than previously estimated (SCB EIC forecasted 17.1%, and the Reuters Poll median projected 18.7%). Seasonally adjusted export data declined by -0.9%MOM_SA from the previous month. Overall, Thai export value in the first half of this year grew by an average of 15% (Figure 1 and Figure 2).
June exports continued to be supported by multiple factors, though several product categories have started to show signs of slowing
(1) The upcycle in computer products, equipment, and components remained a key driver, with this category expanding by 57.7%, albeit slowing from 104% in the previous month. Exports to the US surged by 118%, accelerating from 88.3% in the prior month, while exports to China decelerated to 122.8% from 311.6% previously. Meanwhile, other markets began to contract by -2.4%, following strong growth of 66.8% in the prior month. This product group contributed 5.5 percentage points to the overall Thai export growth of 15.5% this month (CTG).
(2) Front-loading to the U.S. ahead of the full impact of reciprocal tariffs drove a sharp export increase of 41.9%, up from 35.1% in the previous month. Notably, key electronic products not yet subject to additional U.S. tariffs continued to show strong growth: computers, equipment, and components rose by 118%; teleprinters, telephone sets, and parts by 9.4%; and electrical circuit boards by 36.9%. In contrast, exports of motor cars, parts, and accessories—already subject to a 25% product-specific tariff—edged down by -2.6% this month. Overall, exports to the U.S. contributed 7.5 percentage points to Thailand’s total export growth of 15.5% in June (CTG).
(3) Gold remained a key driver of export growth. Exports of unwrought gold continued to rise considerably by 115.6%, accelerating from 59.6% in the previous month. However, this marked a notable slowdown compared to 256% and 272.2% growth in April and March 2025, respectively. Switzerland was the main export market this month, with growth reaching as high as 421.5%. Exports of unwrought gold contributed 2.4 percentage points to Thailand’s total export growth of 15.5% this month (CTG). Meanwhile, the special boost from gold-platinum alloy exports to the Indian market—an important factor earlier this year—has clearly faded.
(4) Base effect – The export value in June 2024 was relatively low compared to other months and to the typical June average in the pre-COVID period. As a result, part of the high export growth in June 2025 can be attributed to the low base effect.
The value of merchandise imports slowed in line with the export value.
The value of merchandise imports in June stood at USD 27,588.2 million, expanding by 13.1%, down from 18.0% in the previous month. This marked a sharper-than-expected slowdown (SCB EIC forecasted 14.5% and the Reuters Poll median projected 17.8%). Capital goods were the main contributor, growing by as much as 38.2%—particularly imports from China, which rose by 48.7%, up from 45.9% in the prior month, accounting for 48.6% of Thailand’s total capital goods imports this month. Imports of arms and ammunition, consumer goods, vehicles and logistics equipment, and raw and intermediate materials (including gold) expanded by 29.8%, 19.8%, 11.7%, and 7.2%, respectively. Meanwhile, imports of fuel products continued to decline by -10.6%. (Figure 3)
Thailand’s trade balance (customs basis) recorded a surplus of USD 1,061.7 million this month, close to SCB EIC’s estimate of USD 1,200 million and the Reuters Poll median of USD 600 million. For the first half of 2025, the cumulative trade balance registered a deficit of USD -62.2 million.
SCB EIC assesses that strong front-loaded exports in the first half of the year, combined with a one-month delay in Trump’s retaliatory tariffs, have supported this year’s export outlook. However, next year faces elevated risks of sharp contraction.
The outlook for Thai merchandise export value in 2025 has improved, shifting from flat growth to modest expansion. This revision reflects strong Q2 export performance, driven by accelerated production ahead of U.S. reciprocal tariffs (front-loading). The one-month delay of the tariff hike to August 1 has also slightly lifted the global economic outlook for this year from 2.3% to 2.4% (Figure 4).
Nevertheless, Thai exports in late 2025 and the overall outlook for 2026 remain at risk of contraction due to the increasing impact of U.S. tariff measures. These risks are expected to materialize more clearly once the U.S. fully implements both the reciprocal and specific tariffs as announced. Moreover, key drivers of export growth seen in the first half of 2025—such as the electronics upcycle, front-loaded shipments ahead of U.S. tariff hikes, and the special factor from gold exports—are gradually dissipating.
Special Highlight (1): Only six countries have successfully reached trade agreements with the United States.
After the United States postponed the implementation of reciprocal tariffs for over 100 days, many countries have revised and submitted various proposals to reach trade agreements with the U.S. before the August 1 deadline. Nevertheless, as of now, only six countries have successfully reached agreements with the United States, namely:
Non-ASEAN countries.
· United Kingdom: The United States agreed to maintain the reciprocal tariff rate at 10% but reduce the product-specific tariff on the first 100,000 cars to 10%, down from 25%. It also granted exemptions for certain aerospace products and established low-tariff quotas for steel and aluminum exports to the U.S. In return, the United Kingdom agreed to lower non-tariff barriers, expand market access for U.S. goods such as beef and ethanol, comply with U.S. supply chain security standards, and participate in structured negotiations in key sectors—namely automotive, aerospace, steel, and aluminum—to enhance transparency and alignment with U.S. regulations.
· China: The United States temporarily reduced reciprocal tariffs to 30% (down from 145%). However, when including the previous 25% tariff under Trump 1.0, the total tariff increase on Chinese goods remains at 55%. The U.S. also lowered the De Minimis tariff rate on small-value imports from China to 54% (from 120%) and eased certain trade barriers previously imposed on China. In return, China imposed a 10% tariff on U.S. goods and slightly relaxed export controls on rare earth elements and magnets.
· Japan: The United States agreed to reduce reciprocal tariffs to 15% (from 25%) and may also lower the product-specific tariff on Japanese automobiles to 15% (as announced by Japanese authorities, though not yet confirmed by the U.S.). In return, Japan agreed to enhance market access for certain U.S. goods, such as trucks and rice, and committed to increasing its investment in the United States by USD 550 billion.
ASEAN countries.
· Vietnam: The United States reduced reciprocal tariffs to 20% (down from 46%) and imposed a 40% tariff on goods from other countries exported via Vietnam, aimed at preventing transshipment—particularly from China. In return, Vietnam agreed to fully open its market to the U.S. by lowering tariffs to 0% and reducing non-tariff barriers (as announced by the U.S.). Vietnam, however, is continuing negotiations to seek a further reduction of reciprocal tariffs below 20%.
· Indonesia: The United States reduced reciprocal tariffs to 19% (down from 32%). For goods from high-tariff countries re-exported through Indonesia, the U.S. will impose a 19% tariff plus the original country’s tariff rate. In return, Indonesia agreed to open nearly its entire market to the U.S. (99%, excluding pork and alcohol due to religious principles), by reducing tariffs to 0% and lowering several key non-tariff barriers. Indonesia also agreed to recognize certain U.S. product regulatory standards and to improve labor standards.
· Philippines: The United States reduced reciprocal tariffs to 19% (down from 20%). In return, the Philippines opened its market to the U.S. by lowering tariffs to 0%. Additionally, the U.S. and the Philippines announced an agreement to expand military cooperation between the two countries.
Special Highlight (2): Progress of Thailand’s Trade Negotiations and the Implications of Market Liberalization.
The fact that Vietnam, Indonesia, and the Philippines successfully reached trade agreements with the United States ahead of others—by granting full market access to U.S. goods in exchange for lower reciprocal tariffs, and allowing the U.S. to impose transshipment tariffs on products with low or limited domestic supply chain content—has established a new benchmark for negotiations between the U.S. and other ASEAN countries. This development may pressure Thailand to expedite trade talks with the U.S. and offer more favorable terms in order to secure similar tariff rate, which would help maintain the price competitiveness of Thai exports in the U.S. market.
According to recent statements from Thailand’s negotiation team, the country has submitted a revised proposal offering broader market liberalization for U.S. goods than in the initial round—raising the proposed coverage from 64% to approximately 90% of imports from the U.S. The remaining share is expected to include key agricultural products, which could have wide-ranging impacts on domestic producers and employment. This expanded offer aims to negotiate a reduction in the reciprocal tariff rate—initially set by the U.S. at up to 36%—to a range of 18%–20%, bringing it in line with, or even below, competitor levels.
The decision by U.S. trading partners—particularly ASEAN countries—to open their markets to U.S. goods is likely to significantly impact Thai exports through the following channel:
1) Thailand’s competitiveness in key export markets such as the ASEAN region: If ASEAN countries adopt the new negotiation benchmark with the U.S., the influx of U.S. goods into the region is expected to increase, compounding the existing issue of Chinese product oversupply (twin influx). This will likely exert downward pressure on regional exports, which could severely impact Thailand’s export sector, given that ASEAN accounted for as much as 23.3% of total Thai export value in 2024. The agricultural and domestic manufacturing sectors are also likely to be affected as they increasingly lose competitiveness against both Chinese and U.S. products.
2) Impact on international relations with China: If transshipment agreements between ASEAN countries and the United States negatively affect China’s economy, this may prompt China to implement retaliatory tariffs. Such a development would pose a downside risk to the export sectors of both ASEAN and Thailand, given that China is also a major trading partner for Thailand—accounting for approximately 11.7% of Thailand’s total export value.
SCB EIC believes that if Thailand liberalizes its market for the United States, it may face a larger influx of U.S. goods compared to other ASEAN countries, due to the following reasons:
1. Thai consumers currently exhibit stronger demand for U.S. goods than many other ASEAN countries. Although Thailand maintains higher import tariffs to protect its domestic consumer goods market—ranking 4th highest in ASEAN in terms of Effective Applied Tariff Rate (EATR) on U.S. consumer goods—it is the 2nd largest importer of U.S. consumer goods in the region. This suggests that even with relatively high tariff protection, demand remains strong. One contributing factor may be Thailand’s relatively high per capita income, which also ranks 4th in the region. (Figure 5)
2. Thailand currently maintains higher levels of domestic market protection compared to many ASEAN countries. When comparing the Effective Applied Tariff Rate (EATR) on overall imports, by product category, and by product group across ASEAN nations for goods imported from the U.S., Thailand imposes higher tariffs than several of its regional peers. This is evident from Figures 6 and 7.
· For total imports, Thailand imposes the second-highest weighted average EATR on U.S. goods in ASEAN, at 6.2%, following Cambodia at 12.9%. The ASEAN average excluding Thailand stands at 3.9%.
· By product category, Thailand imposes a higher EATR on U.S. goods than the ASEAN average (excluding Thailand) in three out of four categories. The only exception is raw materials, for which Thailand applies a lower EATR than the regional average.
· By product group, Thailand imposes a higher EATR on U.S. goods than the ASEAN average (excluding Thailand) in 9 out of 16 product groups—especially for agricultural products, which the U.S. is pressing Thailand to liberalize. For instance, Thailand’s EATR on U.S. vegetables and meats is as high as 38% and 44.3%, respectively, with maximum tariff rates reaching up to 218% for certain items. In comparison, the ASEAN average EATR (excluding Thailand) on U.S. vegetables and meats stands at just 3.1% and 4.8%, respectively, with a maximum tariff rate of 107%.