February 2025 exports rose sharply, driven by gold, electronics, and trade war concerns. Exports in March expected to maintain momentum.
SCB EIC expects Thai exports to grow in H1, but full-year growth may slow to 1.6% due to H2 trade war impacts.
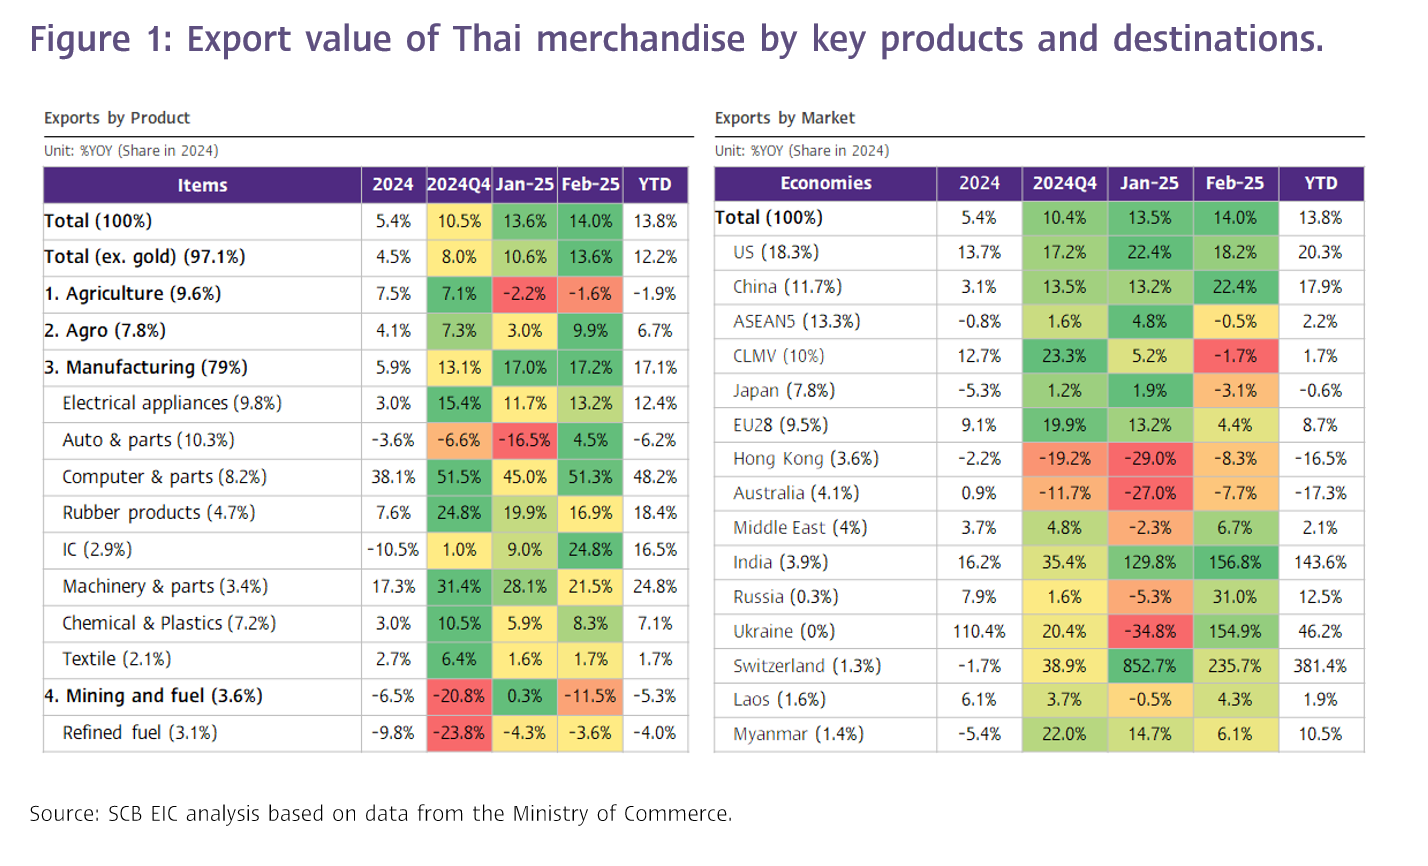
The value of Thai merchandise exports in February 2025 accelerated to 14.0%YOY,
reaching USD 26,707.1 million. This marked an increase from the 13.6%YOY growth recorded in the previous month, aligning closely with prior expectations (SCB EIC estimated at 17.0%, median Reuters Poll at 9.7%). Overall, during the first two months of 2025, Thai exports expanded by 13.8%.
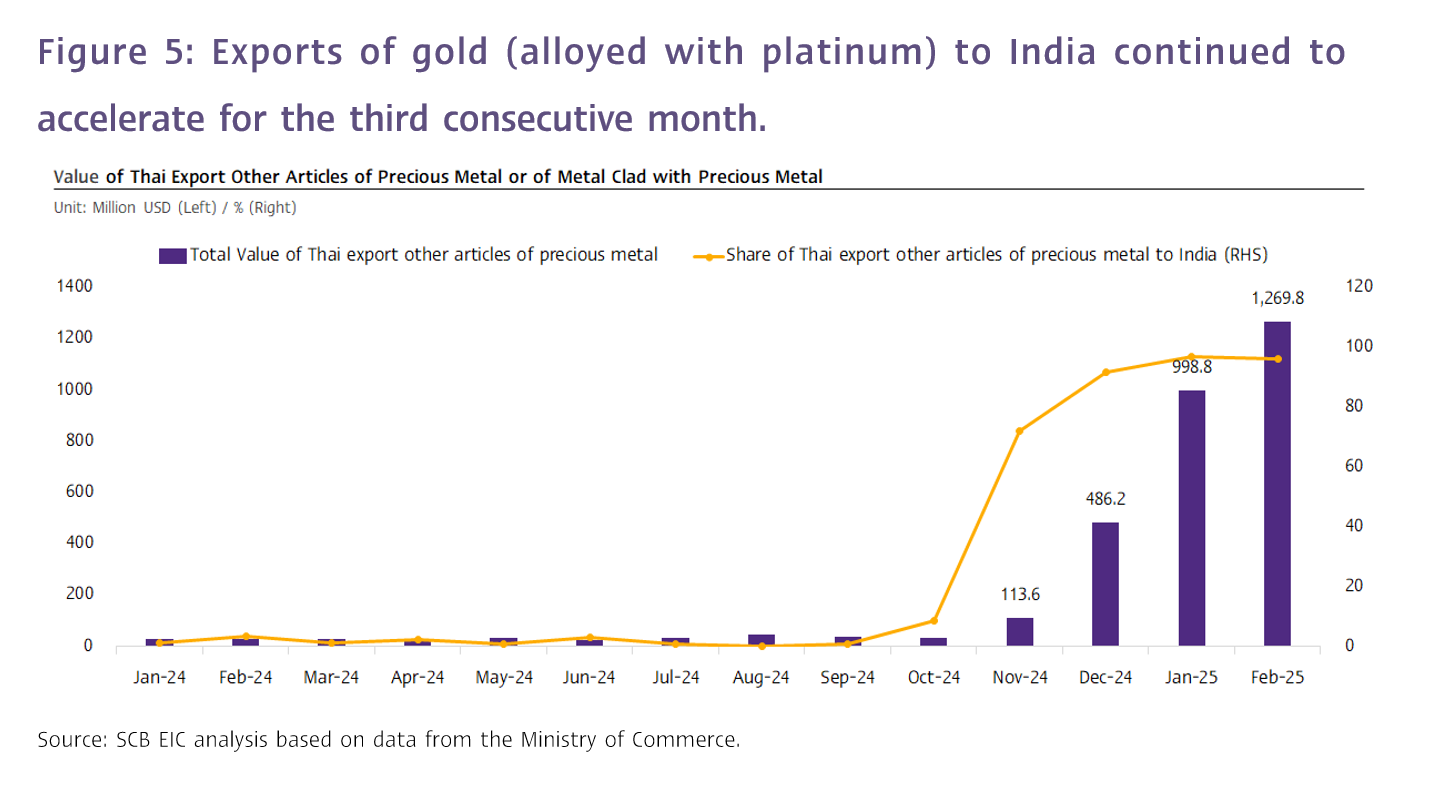
Gold exports and gold-related special factors remained key contributors to Thai export growth in February 2025. Exports of precious metals and articles clad with precious metals surged by as high as 4,160%YOY, continuing from 3,418%YOY in the previous month. SCB EIC estimates that nearly all of this increase stemmed from exports of gold alloyed with a small portion of platinum to the Indian market, which began in November 2024 and became more prominent in December 2024, when this category soared by 524,302%YOY. These exports were intended to benefit Indian importers from tariff advantages. In addition, exports of gold continued to expand significantly by 26.1%YOY, following the 148.9%YOY growth in the prior month, especially to Switzerland (339.5%YOY) and Singapore (277.1%YOY).
The sharp increase in gold exports, including exports of precious metals and articles clad with precious metals, significantly contributed to overall export growth in February 2025. Such exports alone accounted for 6.1 percentage points of Thailand’s total export expansion for the month. However, when excluding gold and precious metals and articles clad with precious metals—to better reflect actual export activity—exports still posted a solid growth of 8.2%YOY, improving from 6.2%YOY in the previous month.
Apart from the impact of gold, Thai exports this month continued to benefit from the upswing in the electronics cycle and front-loading of shipments ahead of potential US trade restrictions, continuing from the previous month. This was further supported by China’s post–Lunar New Year import rebound, as reflected by the following:
1. Exports of computers surged by 51.3%YOY, following 45%YOY in the prior month, with notable expansions to the US market (35.2%) and particularly the Chinese market (230.3%).
2. Exports to the US grew strongly by 18.2%YOY, with broad-based expansion across major product categories—especially computers, components, and parts (35.3%), and air conditioners and parts (92.8%)—which are directly linked to trade war–related demand.
3. Exports to China expanded markedly by 22.4%YOY, with growth across various key products, particularly intermediate goods in Thailand’s supply chain connected to Chinese production, which may be affected by the trade war. These included rubber products (41.6%), natural rubber (69.8%), and chemicals (50.5%), along with continued robust growth in computer, components, and parts exports to China (230.3%).
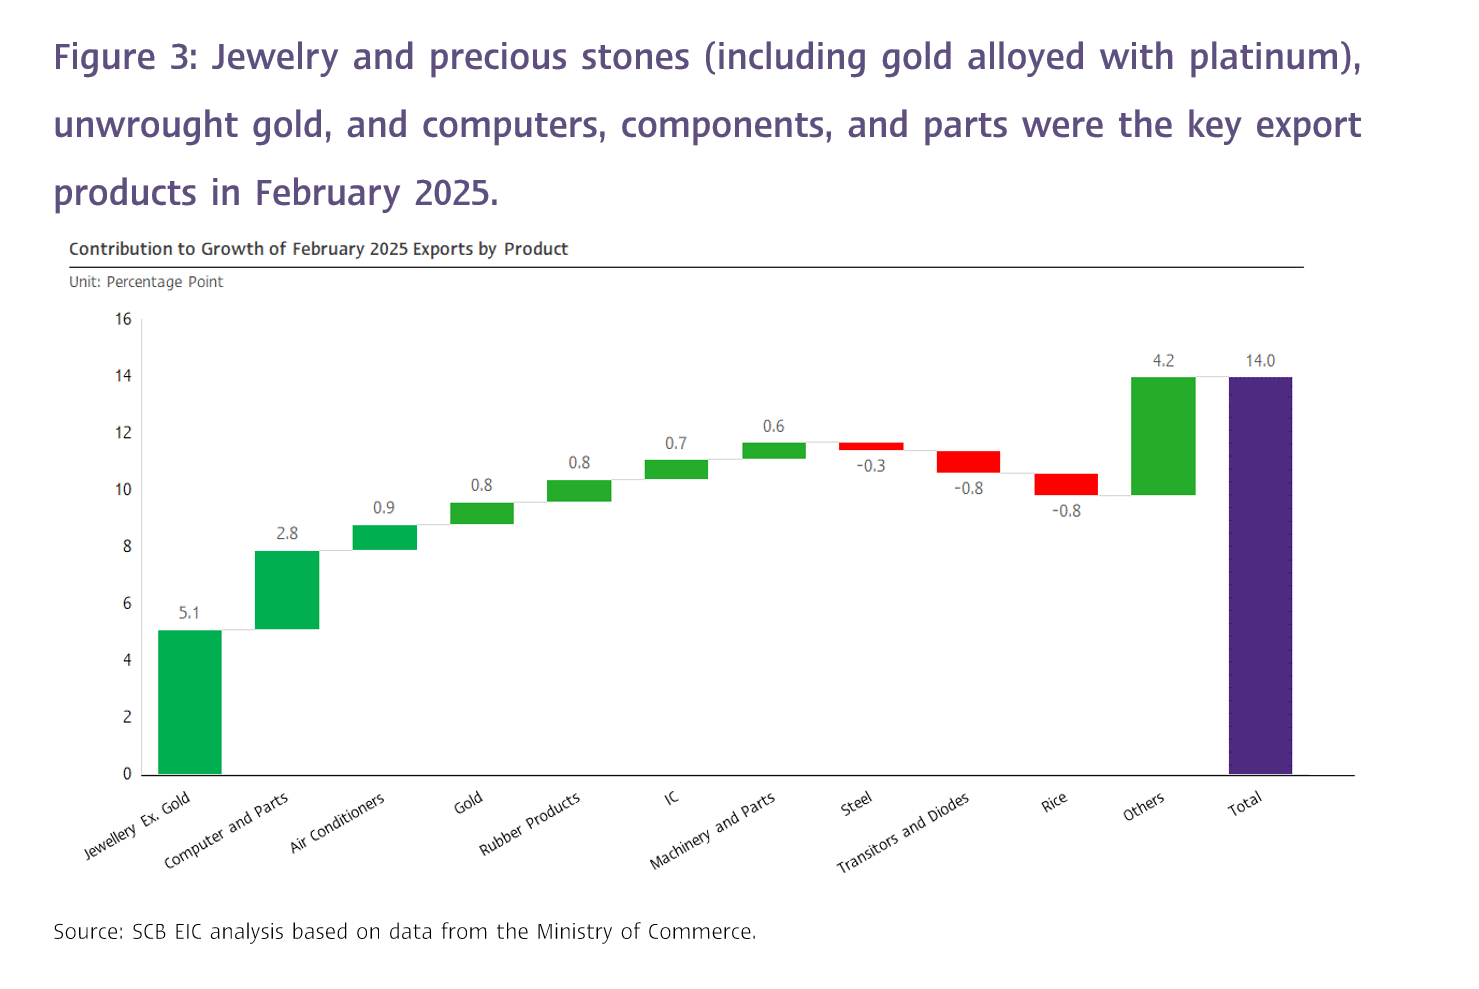
Exports of industrial and agro-industrial products continued to expand well, while exports of agricultural, and mining and fuel products contracted in February.
A breakdown by product category revealed the following:
1. Exports of industrial products expanded by 17.2%YOY, maintaining a solid growth trend for nearly a year. Key contributors included jewelry and precious stones excluding gold, unwrought gold, computers and components, rubber products, air conditioners, and machinery and parts. In contrast, iron and steel, motorcycles and parts, as well as semiconductors, transistors, and diodes, experienced contraction. Excluding gold and precious metals and articles clad with precious metals, exports of industrial products still posted a solid 10%YOY growth.
2. Agro-industrial product exports rose by 9.9%YOY, accelerating from 3%YOY in the previous month. Strong performers included refined sugar, wheat-based and other processed food products, canned and processed fruits, and pet food. However, meat and meat preparations declined.
3. Agricultural product exports contracted by -1.6%YOY, slightly improving from -2.2%YOY in the previous month. Natural rubber and other livestock products saw strong growth, while exports of fresh/chilled/frozen/dried fruits, cassava products, and rice declined.
4. Exports of mining and fuel products returned to a sharp contraction of -11.5%YOY, following a slight expansion of 0.3%YOY in the previous month. Refined oil exports continued to decline by -3.6%YOY, from -4.3%YOY in the prior month—marking six consecutive months of contraction.
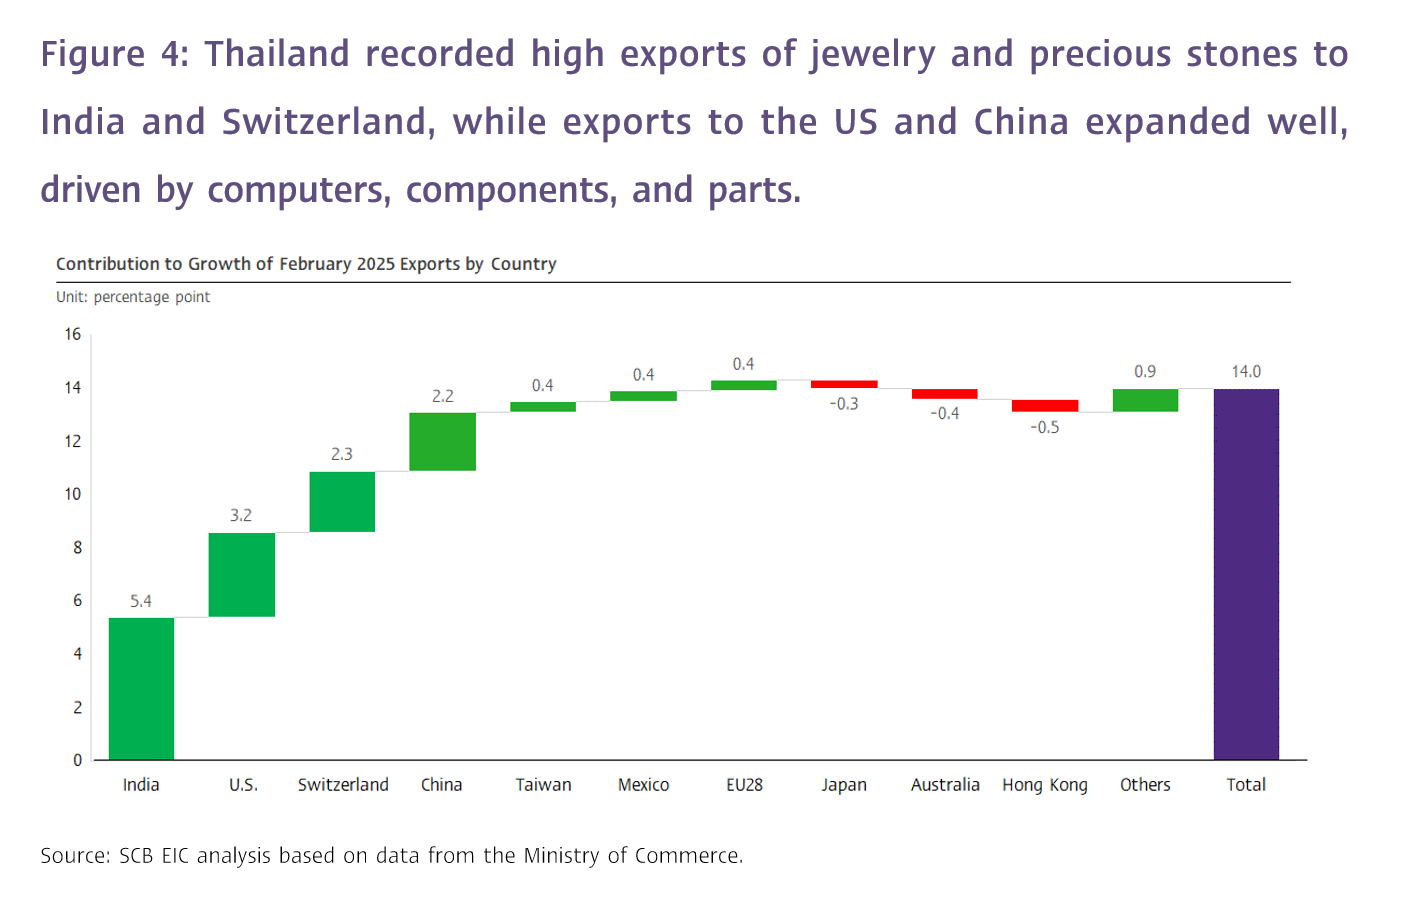
Exports to India and Switzerland continued to expand robustly, driven by strong growth in jewelry and precious stones, while exports to the US and China were supported by computers, components, and parts.
A closer look at key markets reveals the following:
1. Exports to India surged by 156.8%YOY, accelerating from 129.8%YOY in the previous month. The main driver was jewelry and precious stones, which soared by 2,066%YOY, accounting for approximately 62% of Thailand’s total export value to India this month. A key special factor was the export of precious metals and articles clad with precious metals, which reached USD 1,224.5 million, a continued sharp expansion of 111,202%YOY. This followed extreme growth of 524,302%YOY in December 2024 and 241,819%YOY in January 2025, accounting for 96% of Thailand’s total exports in this product category for the month.
2. Exports to Switzerland expanded by 235.7%YOY, moderating from 852.7%YOY in the previous month. The majority consisted of jewelry and precious stones, which rose by 311%YOY, representing 93% of Thailand’s total export value to Switzerland. Notably, unwrought gold exports to Switzerland were valued at USD 701 million, expanding by 339.5%YOY, and making up 75.1% of Thailand’s total unwrought gold exports in February.
3. Exports to the US maintained solid growth at 18.2%YOY, slightly moderating from 22.4%YOY in the prior month. Key electronics-related export products continued to perform well, including air conditioners and parts (92.8%), electric switchboards and control panels (75.2%), and computers, components, and parts (35.3%). In contrast, transformers and components declined by -13.3%YOY, following a 33.7%YOY expansion in the previous month. In addition, exports of jewelry and precious stones grew strongly by 41.1%YOY, marking 14 consecutive months of expansion.
4. Exports to China rose significantly by 22.4%YOY, accelerating from 13.2%YOY in the previous month. The main drivers were computers, components, and parts (230.3%), rubber products (41.6%), natural rubber (69.8%), and chemicals (50.5%)—together accounting for approximately 38% of Thailand’s total export value to China. The strong performance also reflected a post–Lunar New Year rebound in Chinese import demand.
5. Exports to Europe grew at a slower pace of 4.4%YOY, down from 13.2%YOY in the previous month. The number of major export products showing growth in this market dropped to 7 out of the top 15, compared to 10 items in the previous month. Key products that contracted included air conditioners and parts, automobiles, components, and parts, and rubber products. Meanwhile, computers, components, and parts remained the primary growth driver, expanding by 66.2%YOY.
6. Exports to CLMV markets returned to contraction at -1.7%YOY, marking the first decline in 14 months, compared to a 5.2%YOY expansion in the previous month. The main factor was a sharp drop in exports to Cambodia, which fell by -40.7%YOY, particularly due to a -91.9%YOY contraction in jewelry and precious stones—including a -92.0%YOY decline in unwrought gold exports. Refined oil exports to Cambodia also contracted by -22.1%YOY, following a strong 25.3%YOY expansion in the prior month. These two product categories accounted for approximately 26% of Thailand’s total export value to Cambodia in February. On the other hand, exports to Vietnam, Myanmar, and Lao PDR continued to expand by 37.3%YOY, 6.1%YOY, and 4.3%YOY, respectively.
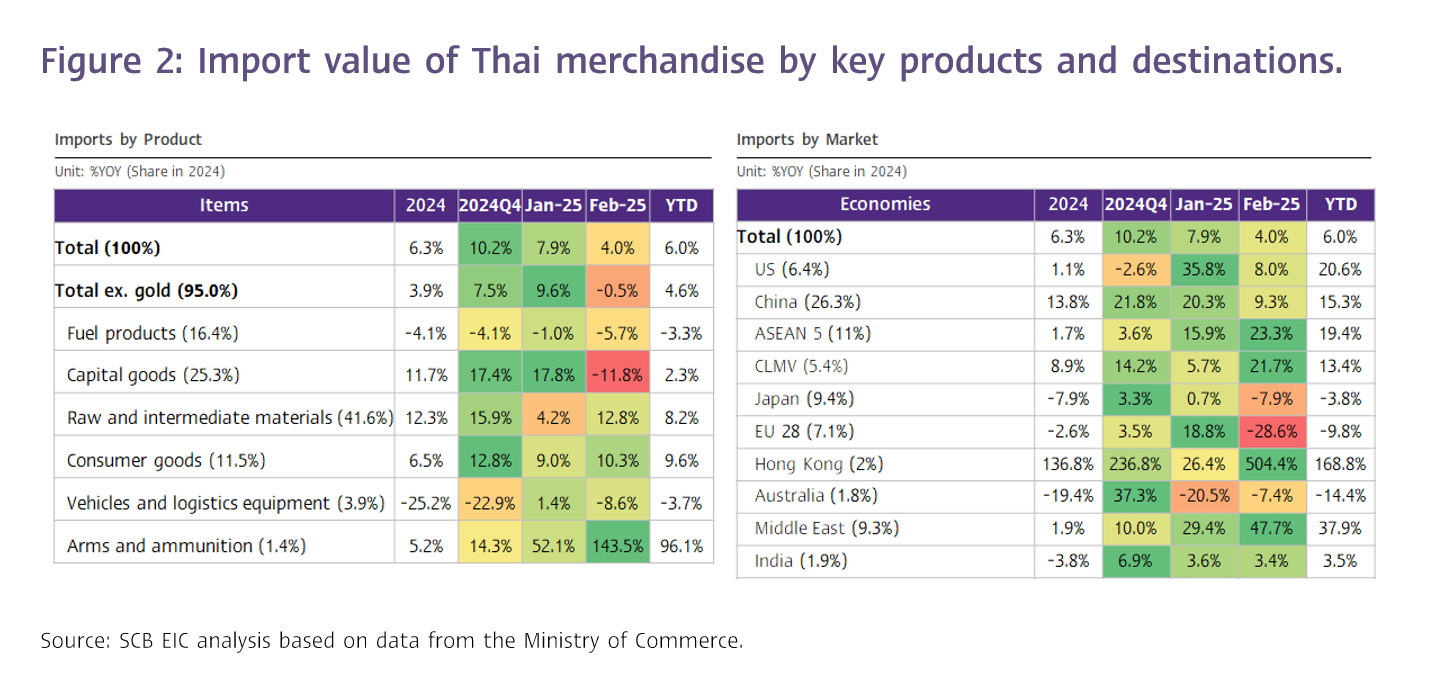
Imports continued to expand for the eighth consecutive month from gold imports., despite a high base effect
The value of Thai merchandise imports in February stood at USD 24,718.9 million, expanding by 4.0%YOY, slightly below the previous month’s growth of 7.9%YOY. This figure aligned with SCB EIC’s estimate of 4.8%YOY, which also matched the Reuters Poll median. Despite the overall import expansion trend continuing for the eighth straight month, imports excluding gold declined by -0.5%YOY, marking the first contraction in four months. This reflects that, during the same period last year, Thailand significantly increased gold imports—either for re-export or for replenishing inventories, in line with the recent sharp rise in gold and gold alloy exports.
While imports of capital goods, vehicles and transport equipment, and fuel products contracted by
-11.8%YOY, -8.6%YOY, and -5.7%YOY, respectively, growth was seen in:
· Arms and military supplies: +143.5%YOY
· Raw materials and intermediate goods (including gold): +12.8%YOY
· Consumer goods: +10.3%YOY
As a result, the customs basis trade balance registered a surplus of USD 1,988.3 million in February. Cumulatively, Thailand recorded a trade surplus of USD 108 million during the first two months of 2025.
SCB EIC expects Thai exports to expand solidly in the first half of the year, but full-year growth is projected to moderate to 1.6% due to trade war impacts in H2.
SCB EIC forecasts that export value in March will continue to grow robustly, supported by the ongoing upswing in the electronics cycle, a surge in front-loaded orders by trading partners ahead of the US trade restriction policies, and continued strong gold exports—including special gold exported to India, as importers accelerate shipments before the Indian government amends import loophole regulations. Additionally, a low base effect from March 2024, when exports contracted sharply by -10.5%YOY, will provide further support to export growth in March 2025.
Nonetheless, Thailand’s export momentum is expected to slow markedly in Q2 and contract in H2, pressured by rising global protectionism. The outlook for Thai exports indicates a significant slowdown in Q2, followed by a contraction in the second half of the year, driven by the increasing adoption of trade, investment, and labor movement restrictions in many countries worldwide—particularly the tightening of trade policies by the US. These measures are expected to weigh on global economic conditions and dampen international trade sentiment. In addition, the front-loading effect, which boosted production and exports in late 2024 and early 2025, is expected to gradually fade. The benefits from the electronics upcycle will also start to decline. Furthermore, a high base effect from H2/2024, when Thailand’s export value expanded by 7.5%YOY in Q3 and 10.5%YOY in Q4, will put downward pressure on export growth in the latter half of 2025, compared to a more modest 1.9%YOY growth in H1/2024 (customs basis).
Overall, SCB EIC projects Thai export value growth in 2025 at 1.6% (as of March 2025), down from the previous forecast of 2.0% (as of November 2024), based on balance of payments data. The revised projection is below the Ministry of Commerce and government’s target of 3–3.5%, reflecting SCB EIC’s view that most of the export drivers in Q1 were temporary factors, such as gold alloyed with a small portion of platinum exports to India. Meanwhile, pressures on the global economy and international trade are expected to intensify significantly in H2, particularly in Q4.