Thai Export Figures for January 2025 Driven by Gold, Upturn in Electronics Cycle, and Preemptive Acceleration ahead of Protection Measures
Thailand’s export growth in January 2025 was driven by a surge in gold exports and a special factor in precious metals.
Thai exports in January 2025 surged by 13.6% YoY,
reaching USD 25,277 million, accelerating from the previous month’s growth of 8.7%. This figure significantly exceeded expectations (SCB EIC estimated 6.9%, while Reuters Poll had projected 7.2%). The primary drivers behind this sharp growth were the strong boost from gold exports, the upturn in the electronics cycle that led to increased demand for electronic components, and the preemptive acceleration of exports ahead of impending U.S. trade protection measures, which are expected to have widespread effects.
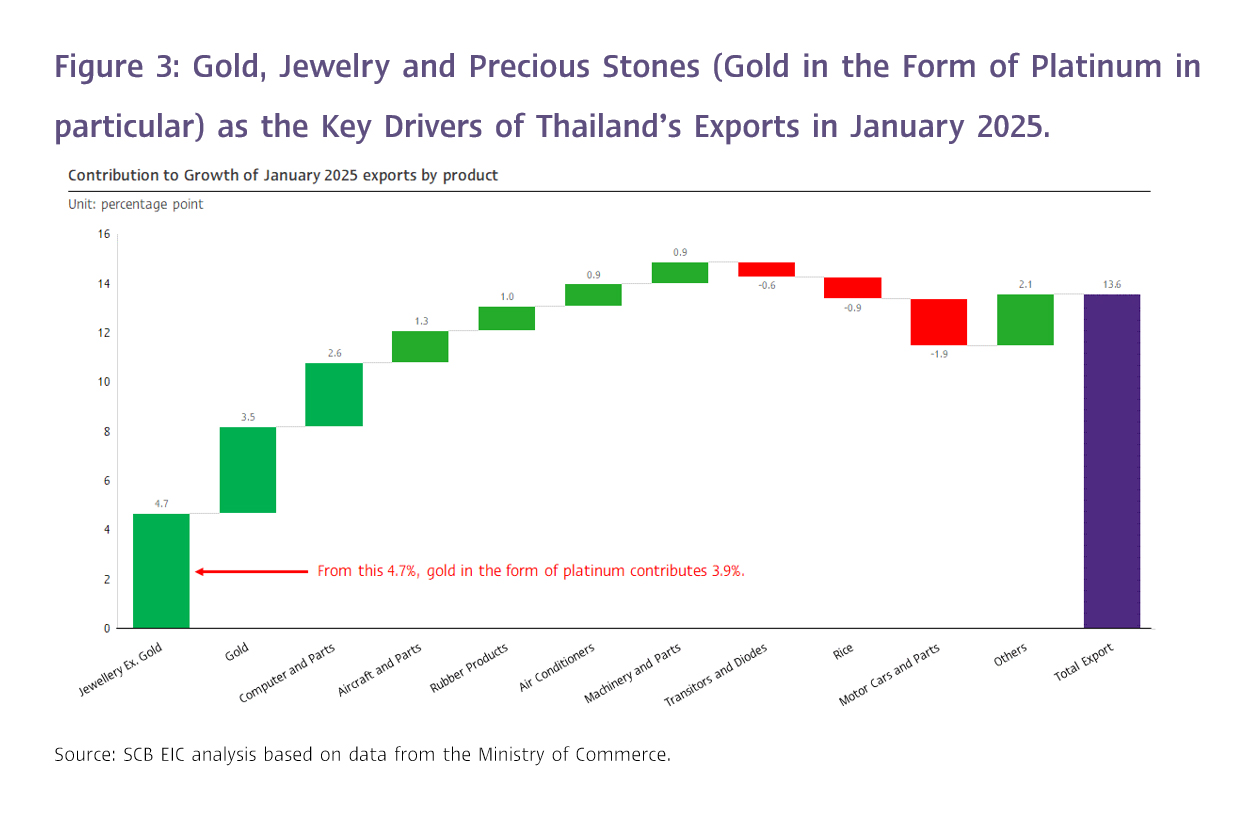
The strong expansion in Thailand’s exports in January 2025 was primarily driven by the sharp surge in gold exports and a special factor related to precious metals. Gold exports soared by 148.9% YoY, a significant jump from 7.2% in the previous month, with particularly remarkable growth in exports to Switzerland (5,716.1%) and Singapore (2,577.9%). Additionally, SCB EIC identified a special factor contributing to this surge: exports of other articles of precious metal or of metal clad with precious metal skyrocketed by 3,418.1%, almost entirely destined for India. SCB EIC assessed that this was primarily gold exports mixed with a small proportion of platinum to optimize tax benefits for Indian importers. This special factor, alongside the overall gold export surge, significantly contributed 7.4% to Thailand’s total export growth of 13.6% in January 2025. However, when excluding gold exports (to reflect actual export activity), the growth was only 6.2%, indicating that a substantial portion of the expansion was due to gold and related products rather than a broad-based improvement in exports.
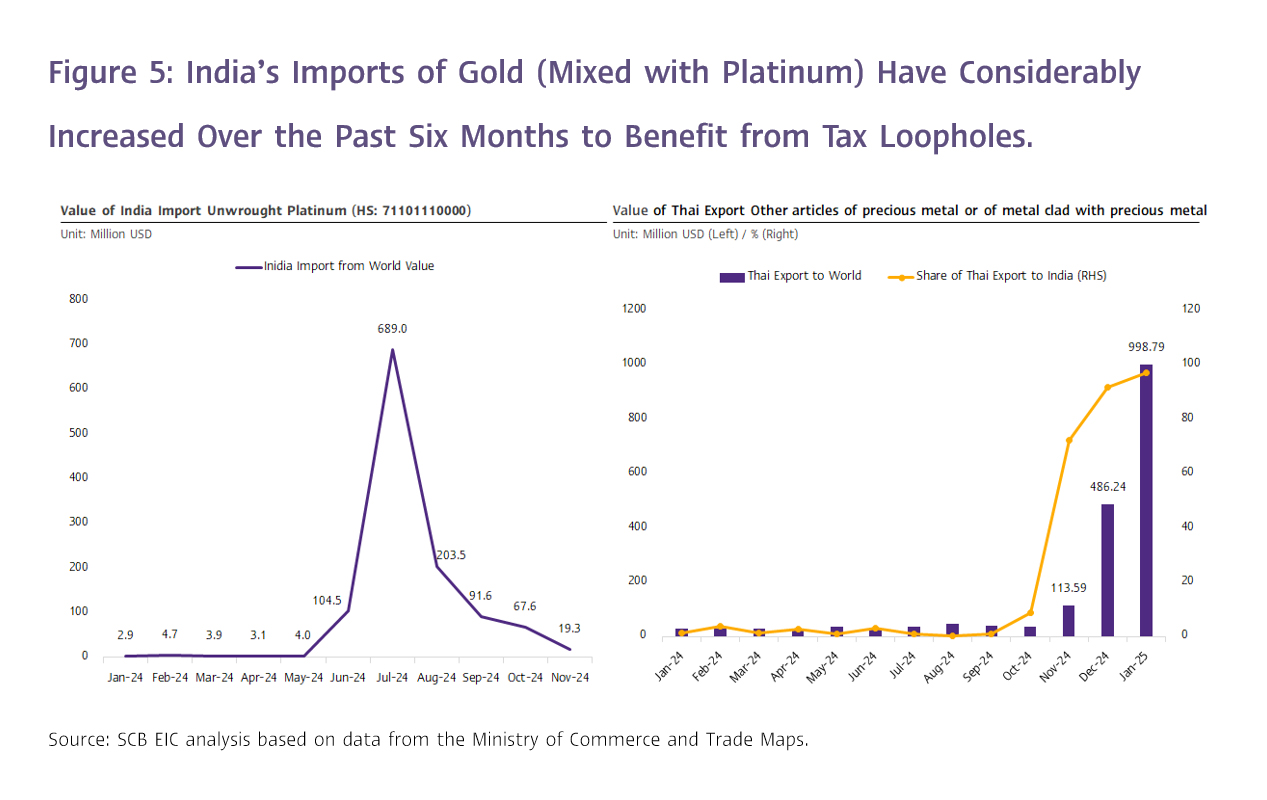
The special factor related to gold exports emerged due to multiple India’s adjustments in import duty rates on gold, silver, platinum, gemstones, and jewelry multiple times between 2022 and 2024. These adjustments aimed to curb gold smuggling and support the domestic gems and jewelry industry. The 2024 revision created a legal loophole, prompting some Indian gold importers to shift toward importing gold mixed with platinum and silver. Under the new regulation, gold containing at least 2% platinum or silver from the UAE was subject to a lower import duty compared to regular gold imports under the India-UAE Comprehensive Economic Partnership Agreement (CEPA). As a result, India’s imports of gold mixed with platinum (classified as "Platinum, unwrought or in powder form: in lumps, ingots, cast bars, or in powder form") from the UAE surged significantly from the normal range of approximately USD 3–8 million per month to USD 103.3 million in June 2024 and further to USD 668.2 million in July 2024.
On July 24, 2024, the Indian authorities revised the import duty structure once again to close the legal loophole that had allowed the import of gold mixed with platinum or silver from the UAE under preferential tax rates. In response, Indian importers shifted their strategy, sourcing gold mixed with platinum instead from Tanzania, South Africa, and Thailand to take advantage of 0% import duty rates under India's Duty-Free Tariff Preference (DFTP) Scheme for Least Developed Countries and the ASEAN-India Free Trade Agreement. As a result, Thailand’s exports of Other articles of precious metal or of metal clad with precious metal surged dramatically from the usual USD 20–40 million per month to USD 113.6 million in November 2024, USD 486.2 million in December 2024, and USD 998.8 million in January 2025. However, recognizing this new legal loophole, Indian authorities announced plans to amend the regulation on May 1, 2025, to address the issue.
Exports in January Showed Strong Growth Across Most Categories, Except for Agricultural Products
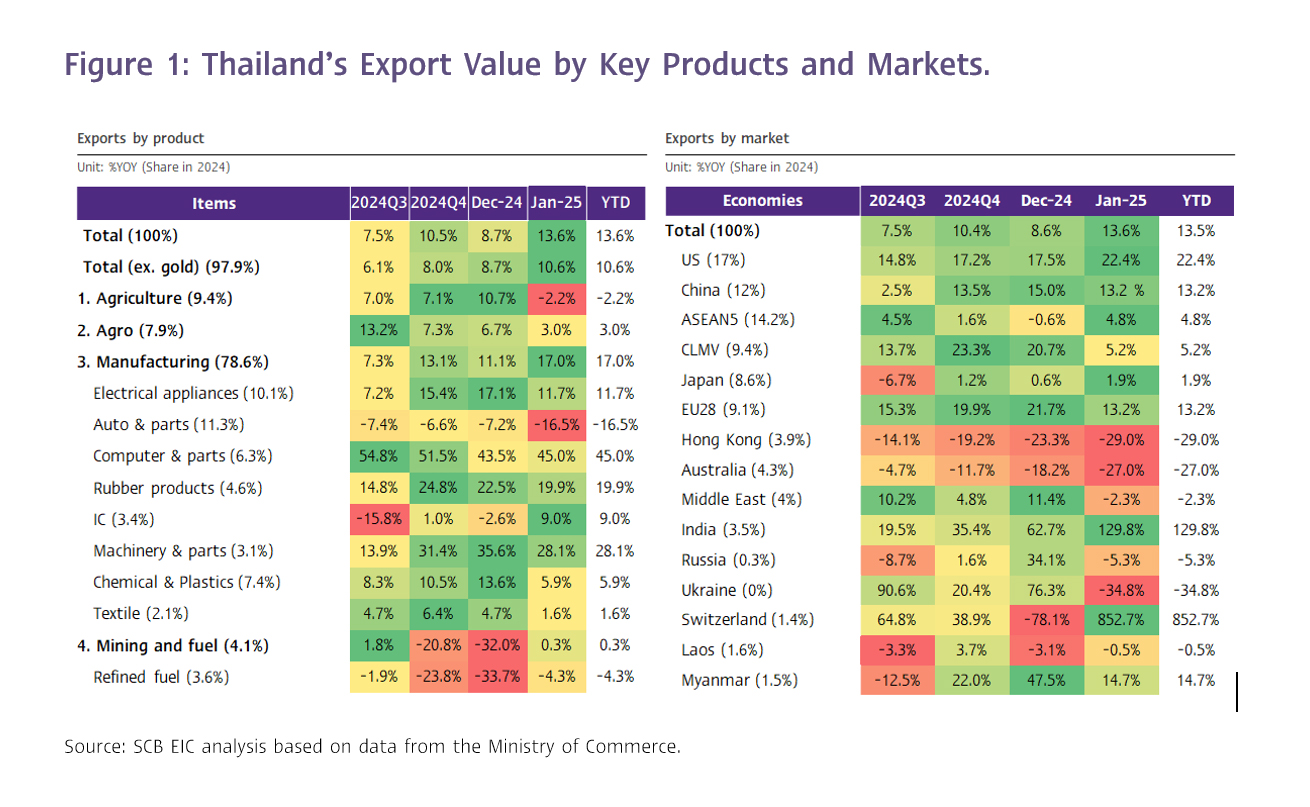
By category, (1) Industrial products grew by 11.1%, marking nine consecutive months of expansion and accelerating from 9.5% in the previous month. Key contributors included precious stones and jewelry (excluding gold), machinery and parts, air conditioners, rubber products, and unwrought gold. However, major products that contracted included steel, internal combustion engines, automobiles and parts, as well as semiconductors, transistors, and diodes. (2) Agricultural products expanded by 10.7%, a substantial acceleration from 4.1% in the previous month, marking six consecutive months of growth. Rubber and cassava products were the key drivers, while rice saw a contraction. (3) Agro-industrial products grew more modestly at 6.7%, slowing slightly from 7.7% in the previous month. Pet food, canned and preserved fruits, and beverages supported growth, while vegetable and animal fats and oils, along with sugar, contracted. (4) Mining and fuels saw a sharp contraction of -32.0%, worsening from -7.1% in the previous month, primarily due to a notable drop in refined oil exports, which declined by -33.7% compared to -16.3% in the prior month (Figure 1 and 2).
Exports to the U.S., India, and Switzerland Expanded Strongly, Driven by Jewelry and Precious Stones, While Exports to China, the EU28, and CLMV Slowed
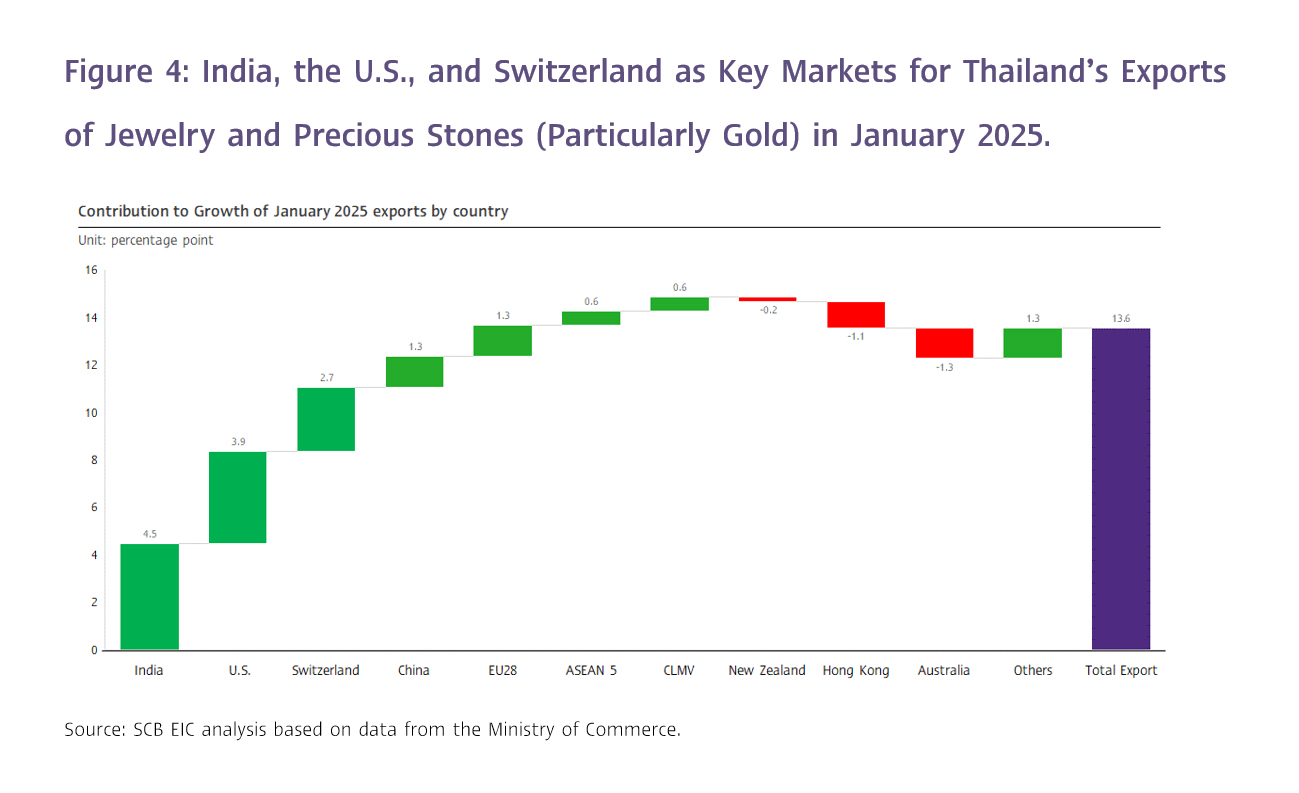
By key markets, (1) India’s exports surged by 129.8%, more than doubling from 62.7% in the previous month. Among the top 15 exported products, 12 saw strong growth, particularly jewelry and precious stones, which soared by 1,846%, nearly tripling from the previous month and accounting for 57.1% of total exports to India. (2) Switzerland's exports rebounded with an 852.7% growth, recovering from a -78.1% contraction in the previous month. This was driven by a 2,822% increase in jewelry and precious stones exports, making up 93.5% of Thailand’s total exports to Switzerland this month, while unwrought gold exports skyrocketed by 5,716%. (3) The U.S. market continued to grow steadily at 22.4%, up from 17.5% in the previous month. This was primarily supported by electronics, including machinery and components (77.9%), computers and accessories (42.6%), air conditioners and components (40.6%), and transformers and parts (33.7%), along with a 36.4% growth in gemstone and jewelry exports. (4) China’s export growth slowed to 13.2%, compared to 15.0% in the prior month. Key contributors included Parts of aircraft and accessories thereof(4,311.7%), wheat-based and processed foods (211.1%), rubber (96.2%), aluminum products (95.77%), and rubber products (85.5%), while electrical circuit boards, fresh, chilled, frozen, and dried fruits, as well as wood and wood products experienced declines. (5) The European market’s growth decelerated to 13.2%, down from 21.7% in the prior month, with 10 out of 15 key export items showing weaker growth. While computer and accessories exports surged by 118.3%, automobiles and parts contracted by -39.4%. (6) The CLMV market saw a significant slowdown to 5.2%, down from 20.7% in the previous month. Exports to Vietnam and Myanmar remained strong at 16.4% and 14.7%, respectively, but Laos contracted slightly by -0.5%, while Cambodia declined by -7.3%, notably due to a -44.4% drop in jewelry and precious stones exports (Figure 4).
Imports Expanded for the 7th Consecutive Month in January, Except for Fuel
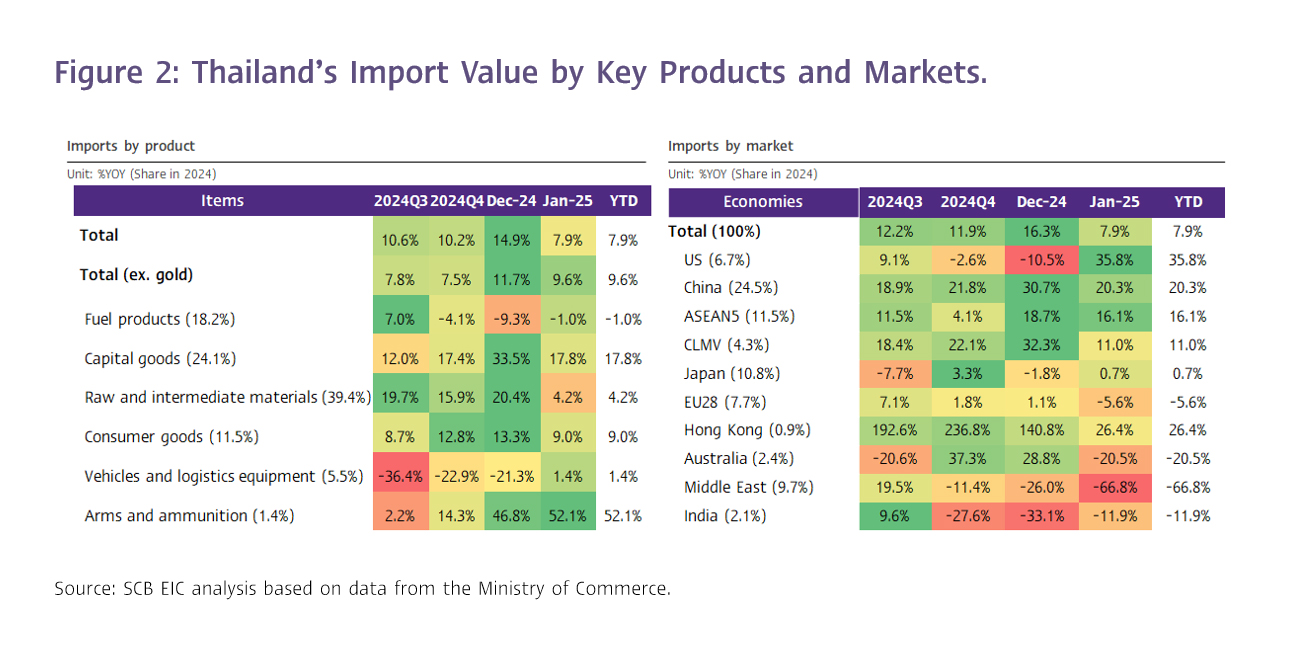
Thailand’s import value in January stood at USD 27,157.2 million, with growth slowing to 7.9%, compared to 14.9% in the previous month. SCB EIC estimated growth at 3.7%, while the Reuters Poll median forecast was 3%. Despite the slowdown, imports continued their 7-month expansion streak. Key contributors included weapons and military supplies (52.1%), capital goods (17.8%), consumer goods (9.0%), raw materials and intermediate goods (4.2%), and vehicles and transport equipment (1.4%). However, fuel imports declined slightly by -1%. As a result, the trade balance (customs basis) recorded a deficit of USD -1,881.2 million in January.
SCB EIC Projects Strong Export Growth to Continue in Q1 2025
SCB EIC forecasts that Thailand’s export value will continue to expand in Q1 2025, supported by several key factors. These include momentum from the previous year, an upcycle in the electronics sector, and accelerated purchasing by trading partners ahead of U.S. trade protection policies. Additionally, rising export prices for oil-related products, such as plastics and petrochemicals, are expected to boost growth, driven by higher oil prices at the beginning of 2025 due to colder-than-expected weather. Other contributing factors include a low base effect from March 2024, which saw a sharp -10.5% contraction, and increased gold exports in the form of other metals to India before new import regulations on gold take effect.
However, Thai exports are expected to face increasing pressure throughout the remainder of 2025 due to several key challenges:
1) A slowdown in global economic growth, driven by protectionist trade, investment, and cross-border movement policies expected to be implemented in multiple countries, particularly the United States. These policies are likely to dampen the global trade environment, especially in H2 2025, as the effects of global trade protectionism and front-loaded production and exports from late 2024 and early 2025 should fade.
2) The demand for Thai intermediate goods exported to China—which are used in the production of final goods for export to the U.S.—may slow down. Additionally, China’s growing overcapacity problem is expected to intensify in the global market, exerting downward pressure on both Thailand’s export competitiveness and domestically manufactured goods. This could create further challenges for Thai exports, particularly in industries that compete directly with low-cost Chinese products.
3) Oil prices and oil-related exports, such as plastics and petrochemicals, are expected to decline due to increased oil drilling activity in the U.S. SCB EIC projects that Brent crude oil prices will average USD 75 per barrel in 2025, lower than USD 80 per barrel in 2024, which could dampen the value of Thailand’s energy-related exports.
4) High Base Effect – Exports in 2024 expanded significantly by 5.4%, with particularly strong growth in Q3 and Q4, reaching 7.5% and 10.5%, respectively (Customs basis).
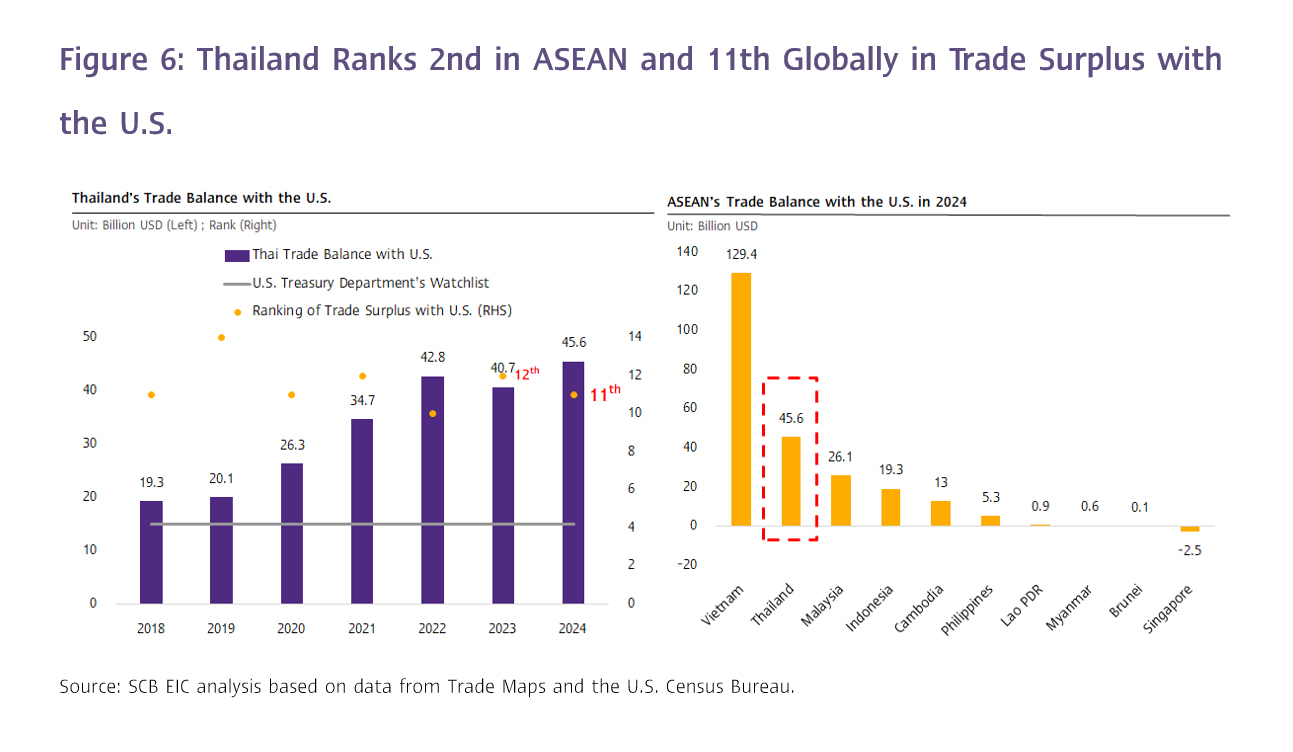
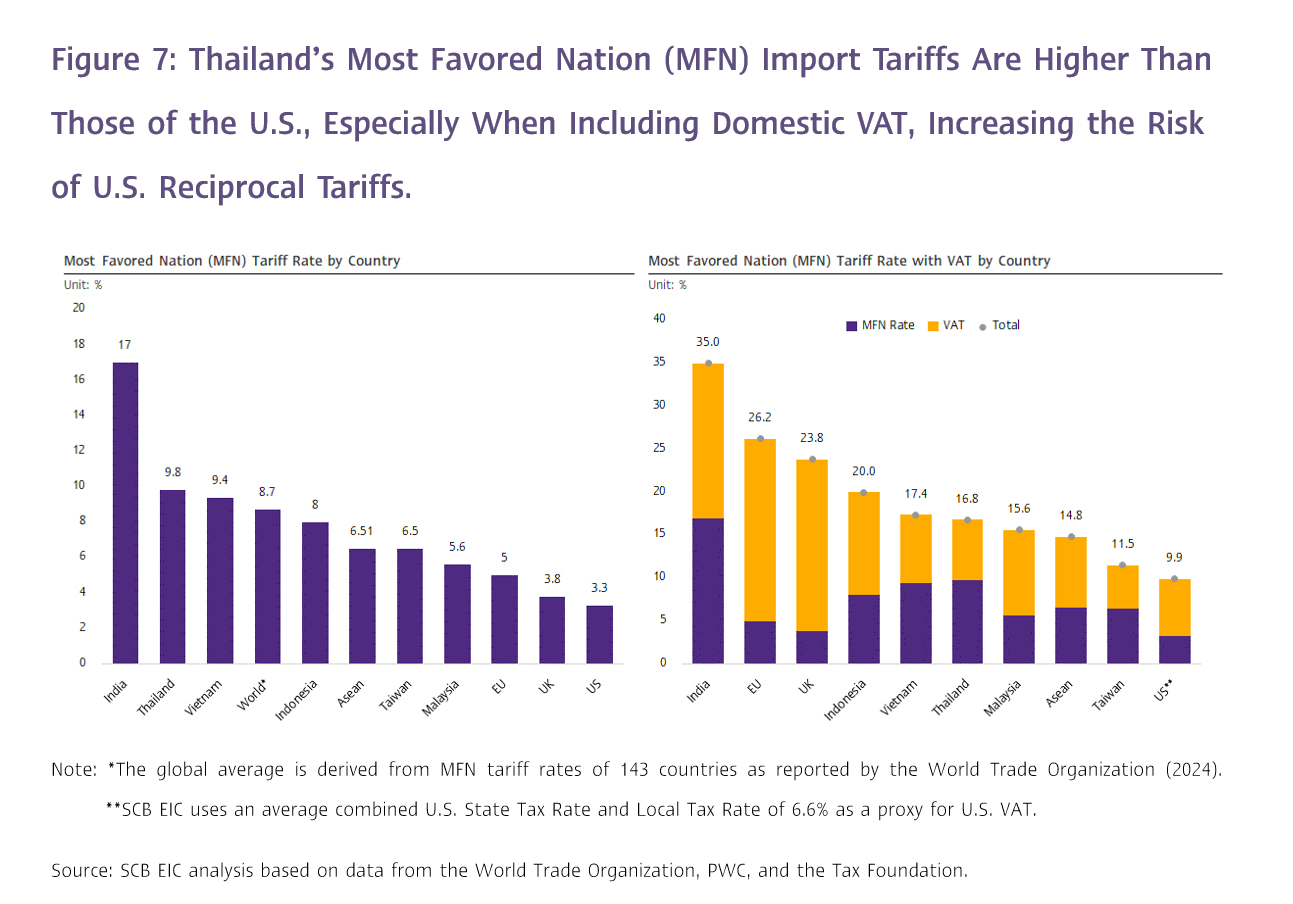
SCB EIC expects Thailand’s exports in 2025 to face increasing risks from U.S. trade protectionist measures, as Thailand has the second-largest trade surplus with the U.S. among ASEAN countries and ranks 11th among all U.S. trading partners (up from 12th place in 2024). Thailand’s trade surplus with the U.S. has more than doubled compared to 2017, before the first wave of the U.S.-China trade war (Figure 6). Additionally, Thailand may face risks from U.S. reciprocal tariffs as early as Q2 2025. This is due to Thailand’s higher Most Favored Nation (MFN) import tariffs compared to the U.S. and the global average (Figure 7). If imposed, these tariffs could further pressure Thailand’s exports to the U.S. beyond previous expectations, adding to existing trade headwinds.
As of November 2024, SCB EIC projected Thailand’s export growth in 2025 at 2% (balance of payments basis). However, SCB EIC is currently reviewing its forecast and plans to release an updated outlook in March 2025.