Exports in December remain robust, but trade war concerns loom over the second half of 2025
The total value of Thai exports in 2024 reached USD 300,529.5 million, expanding by 5.4%.
Exports in December 2024 accelerated by 8.7%, marking six consecutive months of growth.
In December, the value of Thai export reached USD 24,765.9 million, growing by 8.7%YOY (compared to the same period last year). This growth picked up from 8.2% in the previous month and surpassed expectations (SCB EIC had forecasted 7.1%, while the Reuters Poll's median forecast was 8.1%). Excluding gold, export growth remained steady at 8.7%.
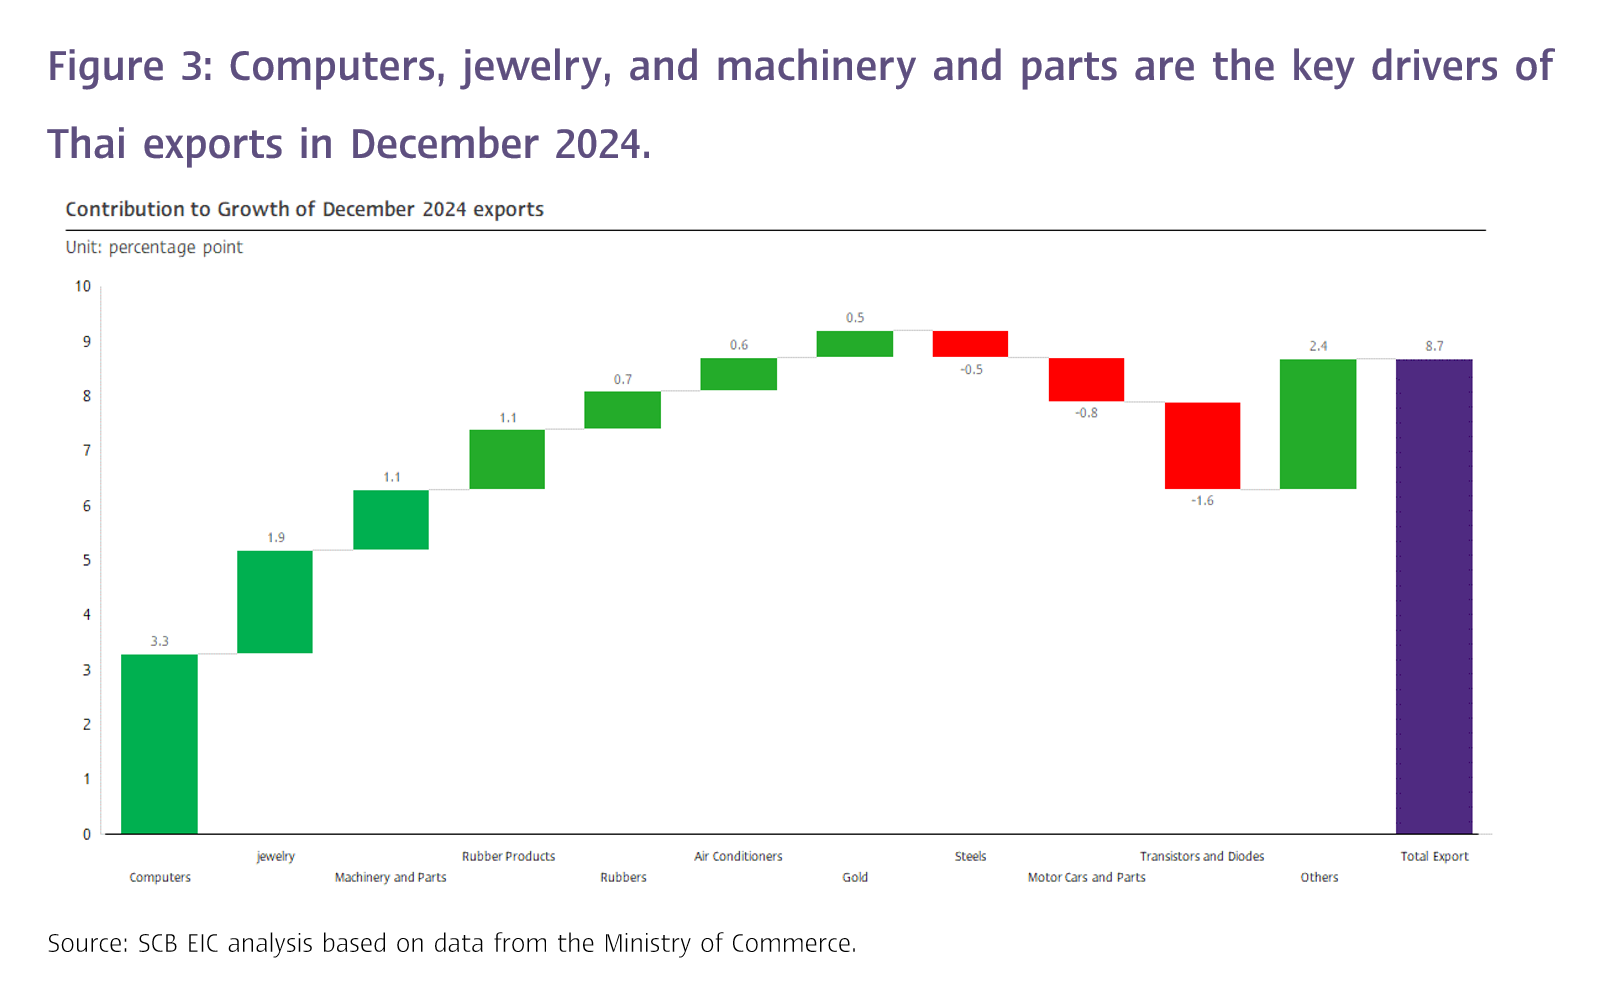
Overall, in December, export continued to perform well, showing consistent growth and a stable adjustment on a seasonally adjusted basis (0%MOM_SA). This was supported by (1) accelerated exports due to concerns over U.S. trade protection measures under President Trump and trading partners, particularly in computers, machinery, and air conditioners, which are at risk of being affected by U.S. import tariff. These three product categories contributed considerably, accounting for 5% of this month’s total export value growth; (2) benefits from the upward cycle in electronics products, especially replacement demand for computers; and (3) high growth in gold exports at 7.2%, albeit slowing down considerably. Gold contributed 0.5% to the overall export growth this month, driven by elevated gold prices and increased demand for gold as a hedge against rising geopolitical risks.
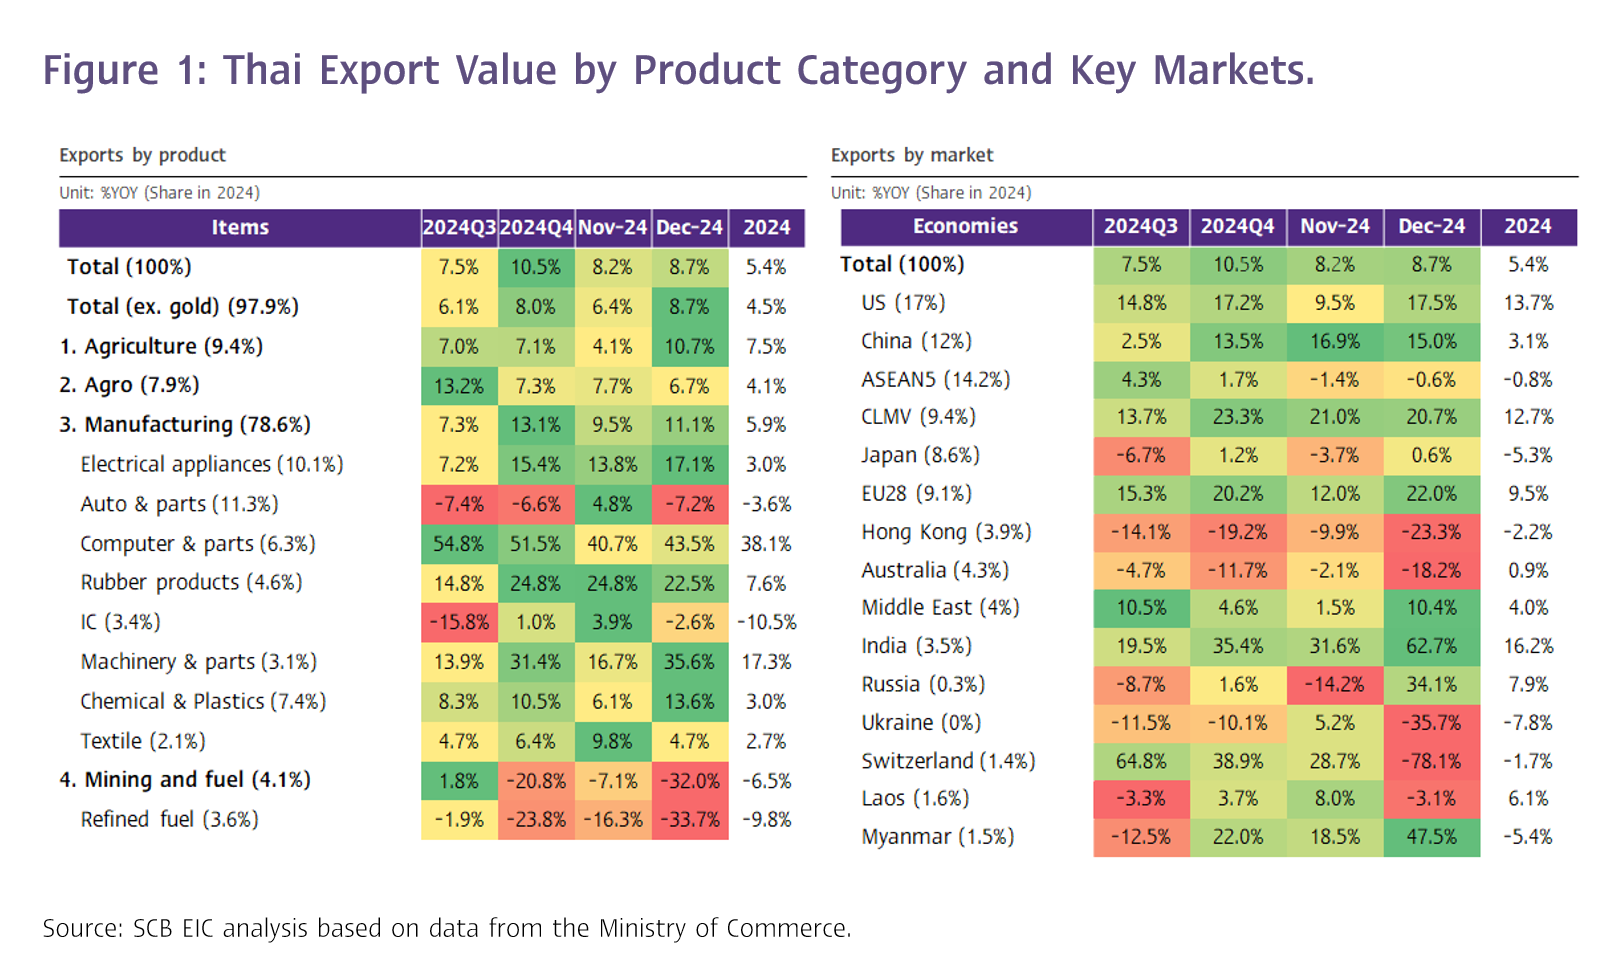
Thai exports in December posted strong growth across nearly all major categories, except for mining and fuels, which continued to contract sharply.
By category, (1) Industrial products grew by 11.1%, marking nine consecutive months of expansion and accelerating from 9.5% in the previous month. Key contributors included precious stones and jewelry (excluding gold), machinery and parts, air conditioners, rubber products, and unwrought gold. However, major products that contracted included steel, internal combustion engines, automobiles and parts, as well as semiconductors, transistors, and diodes. (2) Agricultural products expanded by 10.7%, a substantial acceleration from 4.1% in the previous month, marking six consecutive months of growth. Rubber and cassava products were the key drivers, while rice saw a contraction. (3) Agro-industrial products grew more modestly at 6.7%, slowing slightly from 7.7% in the previous month. Pet food, canned and preserved fruits, and beverages supported growth, while vegetable and animal fats and oils, along with sugar, contracted. (4) Mining and fuels saw a sharp contraction of -32.0%, worsening from -7.1% in the previous month, primarily due to a notable drop in refined oil exports, which declined by -33.7% compared to -16.3% in the prior month (Figure 1 and 2).
Exports posted strong growth in several key markets, particularly the US, China, Europe, and India.
Breaking down by major markets: (1) Exports to the US expanded by 17.5%, nearly doubling from 9.5% in the previous month. Key drivers included air conditioners and parts, board and panels of electric control , computers and components, and machinery and parts, which grew by 160.4%, 92.3%, 63.7%, and 55.5%, respectively. (2) Exports to Europe surged by 22%, up from 12% in the prior month, with 11 out of 15 major export items showing strong growth. Machinery and parts stood out, soaring by 177.5% compared to 14.2% in the previous month. (3) Exports to Japan returned to slight growth at 0.6%, recovering from a contraction of -3.7% in the prior month, with 11 out of 15 key items expanding, up from just 5 items the previous month. (4) Exports to China grew by 15%, slightly slowing from 16.9% in the prior month, as fresh, frozen and dried fruit exports decelerated sharply to 1.8% from 47.6%. Exports of computers and parts also slowed, growing by 78.8%, down from 126.8%. (5) Exports to Hong Kong contracted considerably at -23.3%, worsening from -9.9% the previous month, with electronics being a key contributor to the decline. (6) Exports to CLMV markets expanded by 20.7%, maintaining momentum from the previous month. Refined oil exports to the region saw a sharper contraction of -10.3%, compared to -0.7% in the prior month. Among CLMV countries, exports to Cambodia, Myanmar, and Vietnam grew by 55.3%, 47.5%, and 5.8%, respectively, while exports to Laos reverted to a contraction of -3.1%.
Thai exports in 2024 grew better than expected at 5.4%, driven by strong performance in the second half of the year.
The total value of Thai exports in 2024 reached USD 300,529.5 million, expanding by 5.4%, a considerably improvement from the contraction of -0.8% in 2023 (customs basis). During Q1, export value saw a slight decline of -0.3% but rebounded to grow by 4.3% in Q2, supported by a recovering global economy, the easing of monetary policies in major economies, normalized water levels in the Panama Canal enabling smoother logistics, and favorable prices in various export categories. Agricultural product prices rose due to reduced global supply caused by drought and export restrictions in some countries, such as rice and fresh, frozen and dried fruit. Consequently, exports in the first half of 2024 grew by 1.9%.
In the second half of 2024, export value surged by 9%, with quarterly growth of 7.5% in Q3 and 10.5% in Q4. Key drivers included a notable increase in gold exports, the upward cycle in electronics, and accelerating foreign demand fueled by concerns over potential import tariff hikes, particularly the US, in 2025. Additionally, a low base effect in Q4 further supported growth.
Throughout 2024, Thai exports were driven by all product categories except mining and fuels. Agricultural products recorded the strongest growth at 7.5%, followed by industrial products at 5.9% and agro-industrial products at 4.1%. However, exports of mining and fuels contracted by -6.5%.
In terms of major export markets, notable growth was observed in the US, CLMV, the EU, and China, which expanded by 13.7%, 12.7%, 9.5%, and 3.1%, respectively. Conversely, exports to Japan declined by
-5.3%, marking the third consecutive year of contraction, while exports to ASEAN-5 shrank by -0.8%, similar to the -1.1% contraction in the prior year.
The US remained Thailand’s largest export market, with total export value reaching USD 54,956.2 million, up from USD 48,352.8 million in the previous year. Exports to the US accounted for 18.3% of Thailand’s total export value, increasing from 17% in 2023.
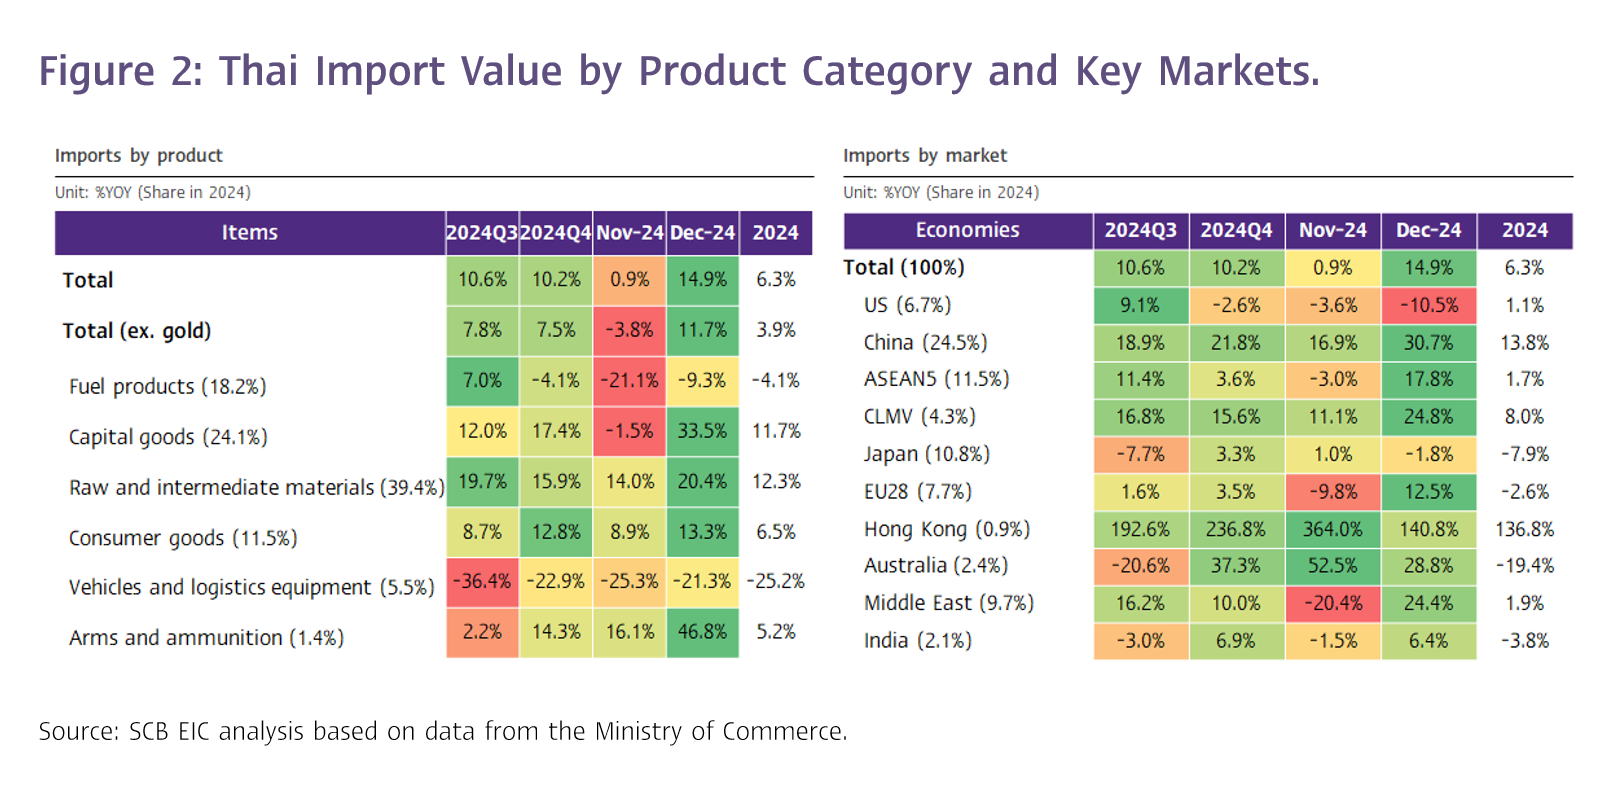
December imports surged as expected due to a low base, while the trade deficit narrowed to its lowest in three months.
Thailand’s import value in December reached USD 24,776.5 million, expanding by 14.9%YOY, aligning with SCB EIC’s forecast of 14.8% and exceeding the Reuters Poll median forecast of 13.7%. This marked
a sharp acceleration from 0.9% in the previous month and sustained six consecutive months of growth. Key contributors included imports of arms and ammunition (up 46.8%), capital goods (up 33.5%), raw and intermediate materials (up 20.4%), and consumer goods (up 13.3%). However, imports of vehicles and logistics equipment as well as fuel products continued to contract at -21.3% and -9.3%, respectively.
For the full year 2024, total import value grew by 6.3%, rebounding from a contraction of -4.2% in 2023. The customs-based trade deficit for December was a modest USD -10.6 million, bringing the total trade deficit for 2024 to USD -6,280.4 million.
In early 2025, exports are expected to continue growing robustly, but headwinds are likely in the second half of the year.
Thai exports in early 2025 are projected to maintain strong growth, driven by accelerated purchasing from trading partners ahead of the anticipated U.S. trade protection policies, coupled with a somewhat favorable base effect. Additionally, the upward cycle in electronics is expected to provide some support, despite risks from U.S. trade policies. Rising oil prices in early 2025, caused by colder-than-expected weather, will likely boost export prices in oil-related products such as plastics and petrochemicals. However,, oil prices may face downward pressure due to U.S. policies to increase oil drilling in the subsequent period.
Thai exports in the second half of 2025 are expected to face heightened pressures due to multiple factors.
1. The global economy is likely to slow down to 2.5% in 2025, down from 2.7% in 2024, due to increasing trade, investment, and border restrictions implemented across many countries. Furthermore, key trading partners are grappling with internal challenges, such as structural issues in China and declining competitiveness and political instability in Europe, particularly in France and Germany.
2. International trade environment could be worsened in the second half of 2025 is likely due to the impact of trade protectionist policies in several countries, especially the U.S., as well as the effects of front-loaded exports during late 2024 and early 2025.
3. A potential slowdown in demand for intermediate goods exported from Thailand to China could emerge, particularly for final goods that China exports to the U.S., amid intensified overcapacity issues in China. This overcapacity is expected to further pressure Thai products’ competitiveness in global markets.
4. The high base effect from 2024, when Thai exports grew by more than 5%, will also weigh on growth comparisons in second half of 2025.
SCB EIC projects Thai export growth for 2025 at 2% (as of November 2024, balance of payments basis). SCB EIC is currently revising its forecast for Thai exports in 2025, with updated projections expected to be released in February.