Thai exports continue to decline in June. While the low base effect might aid export growth in the coming periods, risks stemming from China’s economic recovery warrant monitoring.
Looking ahead, Thai exports may receive support from the low base towards the year-end. However, several downside risks remain.
Thai exports in June continued to decline for the ninth consecutive month.
The value of Thai exports in June 2023 stood at USD 24,826.0 million, dropping by -6.4%YOY. Such a contraction worsened from -4.6% in the prior month. Excluding gold and weaponry, products that do not reflect actual international trade conditions, exports fell by only -5.0%. Moreover, in terms of the seasonally adjusted month-on-month growth, exports in June dropped by only -0.7%MOM_sa. As such, during the first 6 months of 2023, the value of exports stood at USD 141,170.3 million, contracting by -5.4%.
Exports contracted across all key product categories.
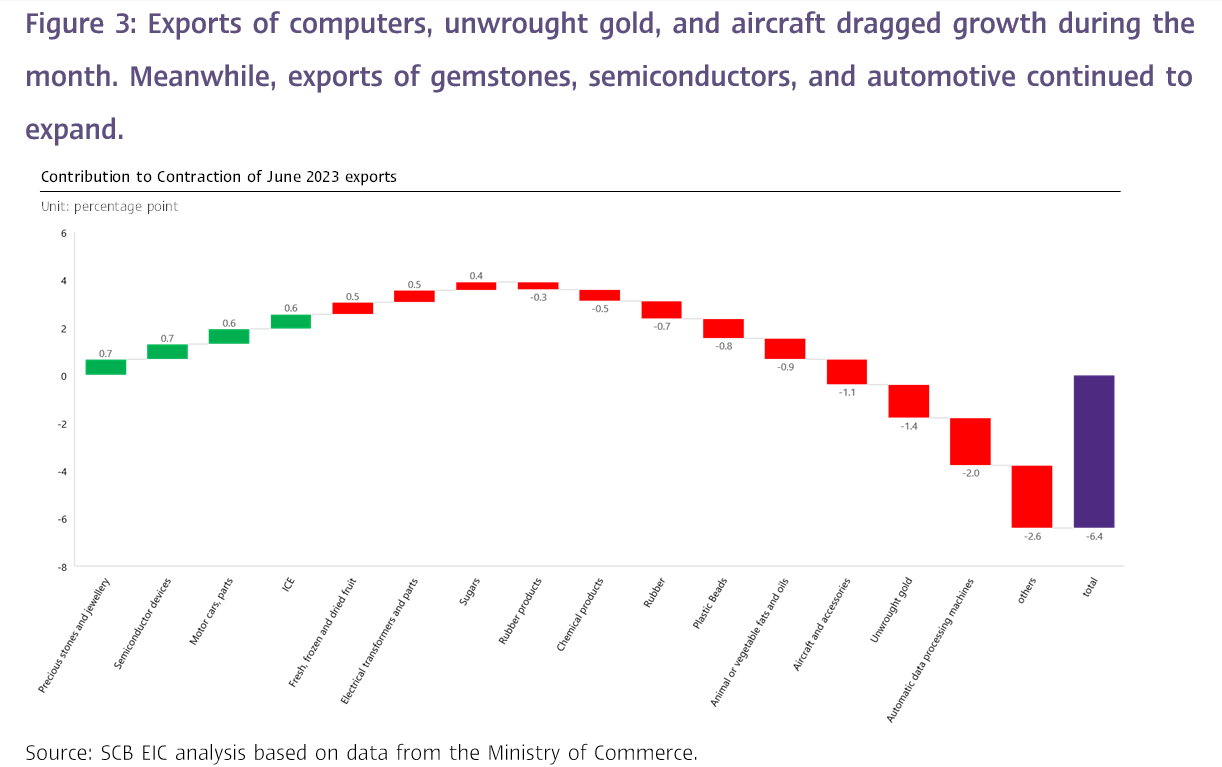
In the big picture, exports contracted across all key product categories in June, in which (1) Exports of agricultural products shrank by -7.4%YOY, improving from the -27% plunge in the prior month. Notably, exports of rubber faced an 11 consecutive months decline, contracting by -43.0% in June. On the other hand, exports of fresh/ chilled/ frozen fruits improved by 14.2% after tumbling by -54.8% in the prior month following higher production from the Southern provinces. Similarly, exports of fresh/ chilled/ frozen chicken continued to increase for 13 consecutive months, with growth at 10.7% in June. Such growth was prompted by the bird flu outbreak in Brazil, which heightened the demand for chicken substitutes from Thailand. (2) Exports of agro-industrial products continued to fall for 3 consecutive months with a drop of -10.2%YOY in June. This decline worsened compared to -0.6% in the prior month. Exports of animal or vegetable fats and oil saw a sharp contraction of -80.8% compared to -63% in the prior month. However, exports of sugar expanded by 31.4%, slightly stalling from 44.2% in the prior month. (3) Exports of manufacturing products reverted to a -4.6%YOY decline after expanding for the first time in 8 months in the prior month. Exports of computer and parts continued to shrink for 9 consecutive months with a contraction of -25.3% in June. Additionally, exports of aircraft, spacecraft and parts fell by -68.8%. Excluding gold, weaponry, and aircraft, exports of manufacturing products shrank by only -1.4%; and (4) Exports of mining and fuel products also declined significantly by -25.5%YOY compared to -39.9% in the prior month. Crude oil contributed to this decline, contracting by -29.0%.
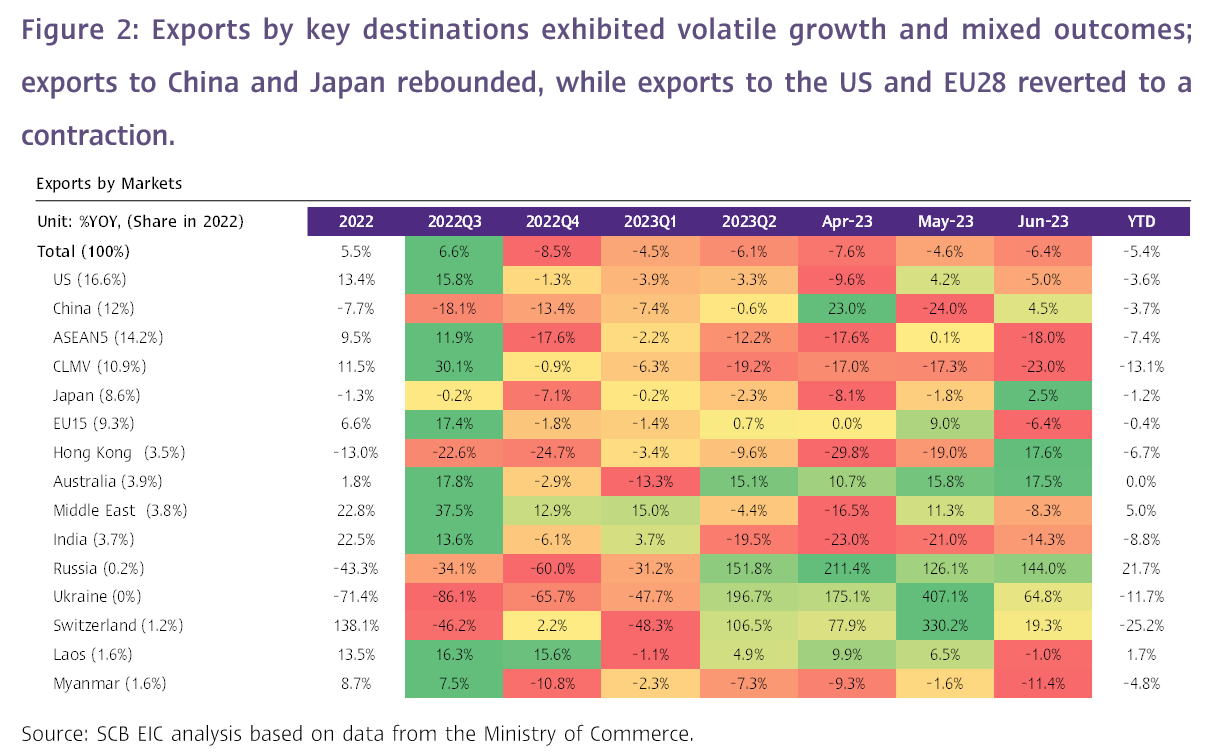
Exports by key destinations exhibited volatile growth and mixed outcomes; exports to China and Japan rebounded, while exports to the US and EU28 reverted to a contraction.
Exports by key destinations saw volatile and mixed outcomes, in which (1) Exports to China rebounded and saw a 4.5%YOY increase after contracting by -24% in the prior month. The rebound was primarily driven by exports of fresh/ chilled/ frozen/ dried fruits (29.1% of total export value to China). Such exports increased by 17.2% in June after contracting in the previous month. Additionally, exports to Hong Kong saw robust growth at 17.6%, with gemstones and jewelry exports surging by an impressive 133.9% YOY. (2) Exports to Japan expanded by 2.5%YOY after contracting by -1.8% in the prior month. (3) Conversely, exports to the US shrank by -5.0%YOY after improving by 4.2% in the prior month. (4) Exports to EU28 fell by -6.4%YOY, declining from 9% growth in the prior month; and (5) Exports to ASEAN tumbled both from ASEAN5 (-18.0%) and CLMV (-23.0%) markets.
Thai trade balance returned to a surplus for the first time in 3 months, mainly due to a sharper contraction in imports compared to exports.
The value of imports in June stood at USD 24,768.4 million, declining by -10.3% and worsening from the -3.2% contraction in the prior month. Excluding gold, a product that does not reflect actual international trade conditions, imports weakened to -11.4%, compared to -1.7% in the prior month. The decline in imports was primarily driven by imports of raw materials and intermediate products (-14.5%YOY, CTG -6.1%) and refined fuel (-19.0%YOY, CTG -4.2%). On the other hand, imports of vehicles and transportation equipment continued to improve for 5 consecutive months, with 10.2% growth in June. As imports experienced a sharper contraction than exports, the customs basis trade balance returned to a slight surplus for the first time in 3 months at USD 57.7 million in June, improving from the deficit of USD -1,849.32 million in the prior month. With such regards, the trade balance during 1H2023 stood at a deficit of USD -6,307.6 million.
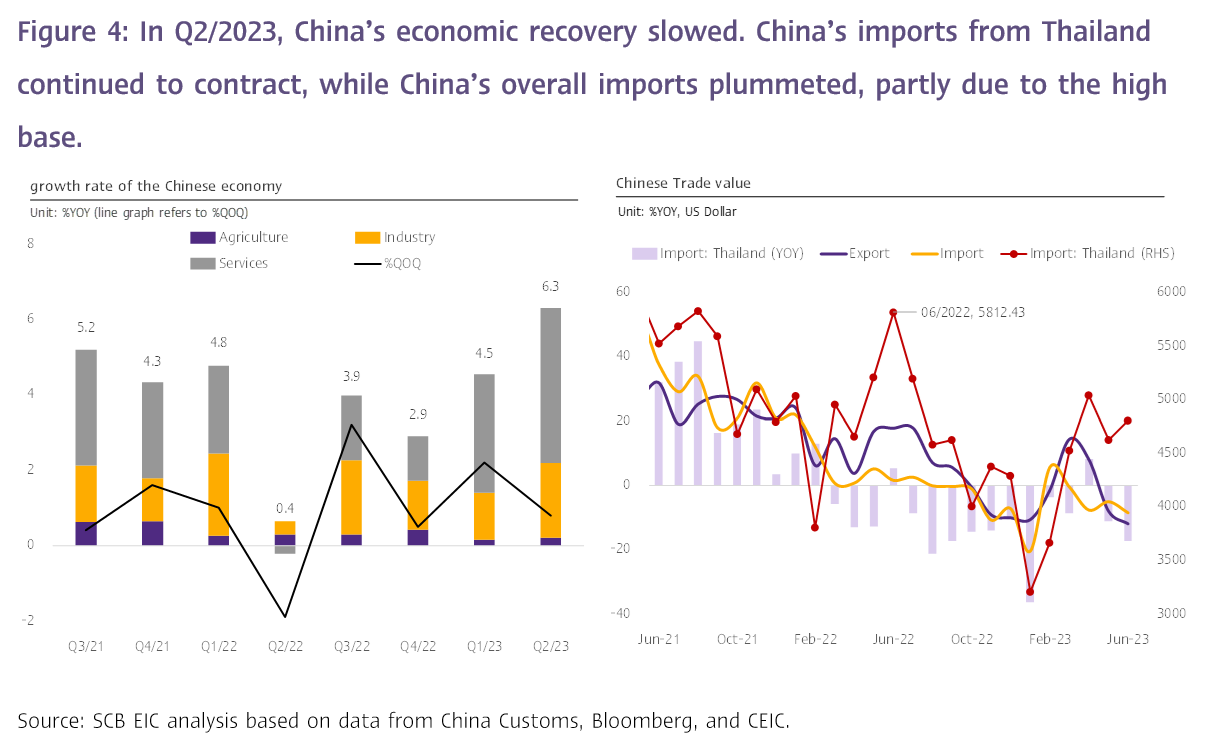
Looking ahead, Thai exports may receive support from the low base towards the year-end. However, several downside risks remain, including the potential slowdown in Chinese’s economic recovery and stalling global economic growth.
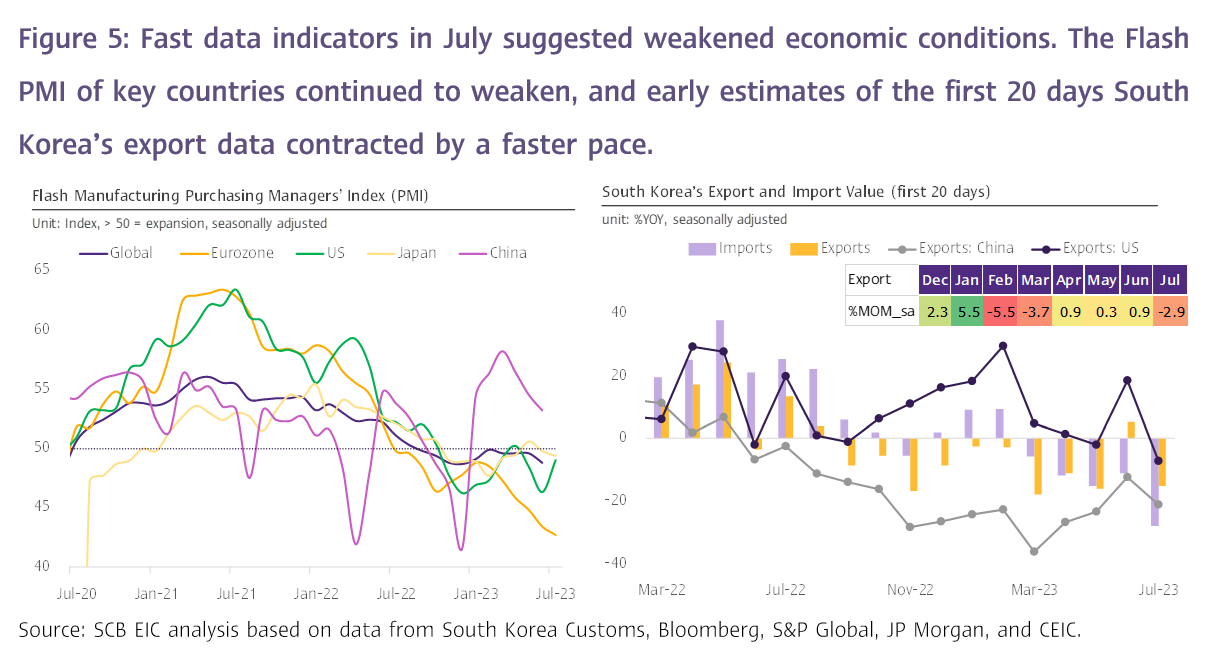
SCB EIC views that Thai merchandise exports during the remainder of 2023 lack several supporting factors, including (1) Slowing Chinese economic recovery. In Q2/2023, China’s economic growth slowed to 0.8%QOQ from 2.2%QOQ in Q1/2023. China’s import figure also continued to drop by -8.6%YOY in June. Meanwhile, China’s imports from Thailand plummeted by -17.4%. Such a condition was partly due to the high base as imports in June 2022 ranked third highest since data collection. However, in terms of the seasonally adjusted month-on-month growth, China’s imports in June expanded by 4.9%MOM_sa. (2) The reading of the Flash Manufacturing PMI1 in July for key trading partnerscontinued to weaken. Indicators from key markets included the Eurozone Manufacturing PMI, in which the reading dropped to 42.7 (from 43.4 in June), the UK Manufacturing PMI that weakened to 45.0 (from 46.5 in June), and the Japan Manufacturing PMI that dropped to 49.4, marking a 4 months low. Meanwhile, the US Manufacturing PMI remained in the contraction zone at 49.0 despite improving from 46.3 in the prior month. (3) Early estimates of the first 20 days South Korea’s export data in July shrank by -15.2%YOY after expanding by 5.2% in the prior month due to the low base. In terms of the seasonally adjusted month-on-month growth, such exports dropped by -2.9%MOM_sa. Furthermore, exports to China and the US continued to weaken with contractions of -21.2%YOY and -7.3%YOY, respectively; and (4) Going forward, risks that warrant monitoring include the potential casualties from El Nino on Thai agricultural output. While the impact may begin in late 2023, the severity is expected to be most pronounced in 2024.
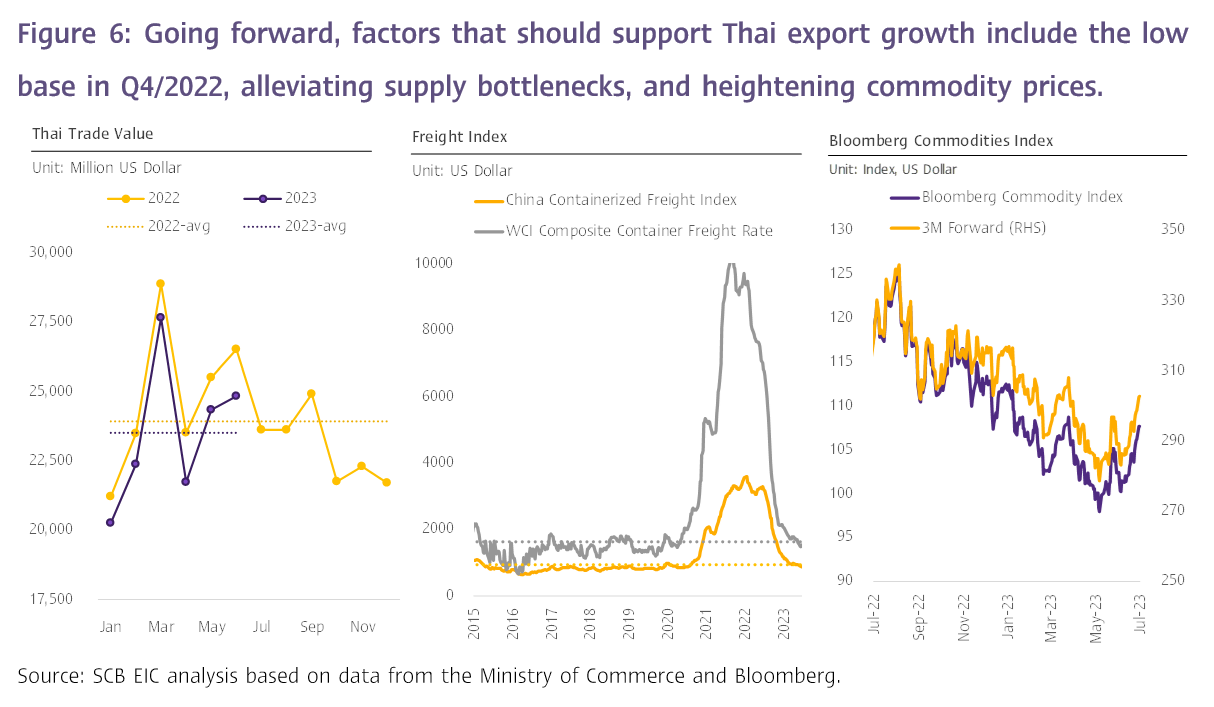
Nevertheless, factors supporting Thai export growth in the periods ahead include (1) The low base, particularly during late-2023. During Q4/2022, the value of Thai merchandise exports averaged USD 22,000 million per month, compared to the 2022 whole-year average of USD 24,000 million per month and the 6M2023 average of USD 23,500 million per month. (2) Supply bottlenecks recovering and returning to pre-COVID levels, reflected by freight charges dropping below the average rate before COVID-19. Such a condition will gradually reduce the pressure built up from high transportation costs; and (3) Commodity prices should increase, leading to higher export value. Factors such as China’s economic recovery and the oil production cuts from OPEC+ are likely to increase energy prices. Furthermore, India’s rice export ban should increase the price of rice exports in the world market in the periods ahead.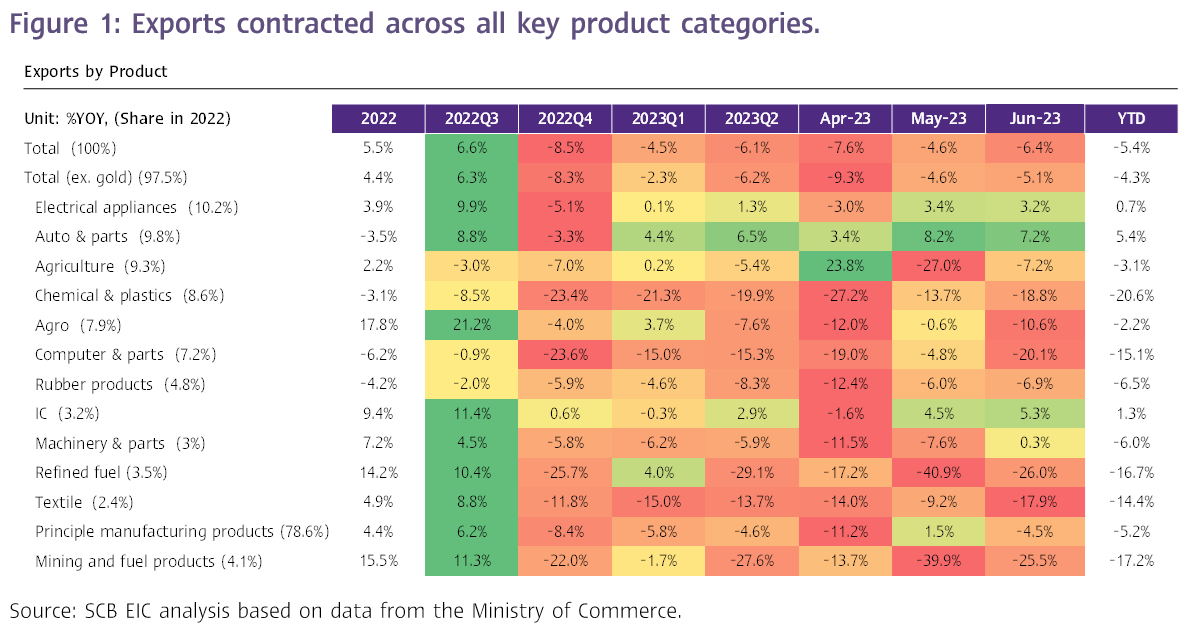
1 Early estimates of the PMI index is based on approximately 85% to 90% of total PMI survey responses each month.