Thai exports fell less than expected in March. Clearer positive momentum signaled despite the high base.
SCB EIC anticipates worrisome Thai merchandise export conditions in H1/2023. However, conditions should gradually improve.
Thai exports in March reached a year high with a contraction far better than anticipatesat -4.2%YOY.
The value of Thai exports in March 2023 was at USD 27,654.4 million, marking a year high and reaching the second-highest monthly export value since export data was collected. Despite the export figure contracting by -4.2%YOY, the fall was considerably lower than market anticipatesat -14.0% (Reuter poll) and dropping by -4.7%YOY from February. Moreover, the performance was satisfactory, especially against the high base in March 2022, a record-high monthly export figure. As such, the value of exports in Q1/2023 stood at USD 70,280.1 million, falling by -4.5%YOY. In terms of the seasonally adjusted month-on-month growth, exports in March expanded by 3.9%MOM_sa, marking 2 consecutive months of %MOM growth. Nevertheless, excluding gold (a product that does not reflect actual international trade conditions), exports only dropped by -0.4%YOY compared to -2.5%YOY in February. Meanwhile, excluding gold and weaponry, exports dropped by -1.5%YOY, reflecting a clearer signal of recovery.
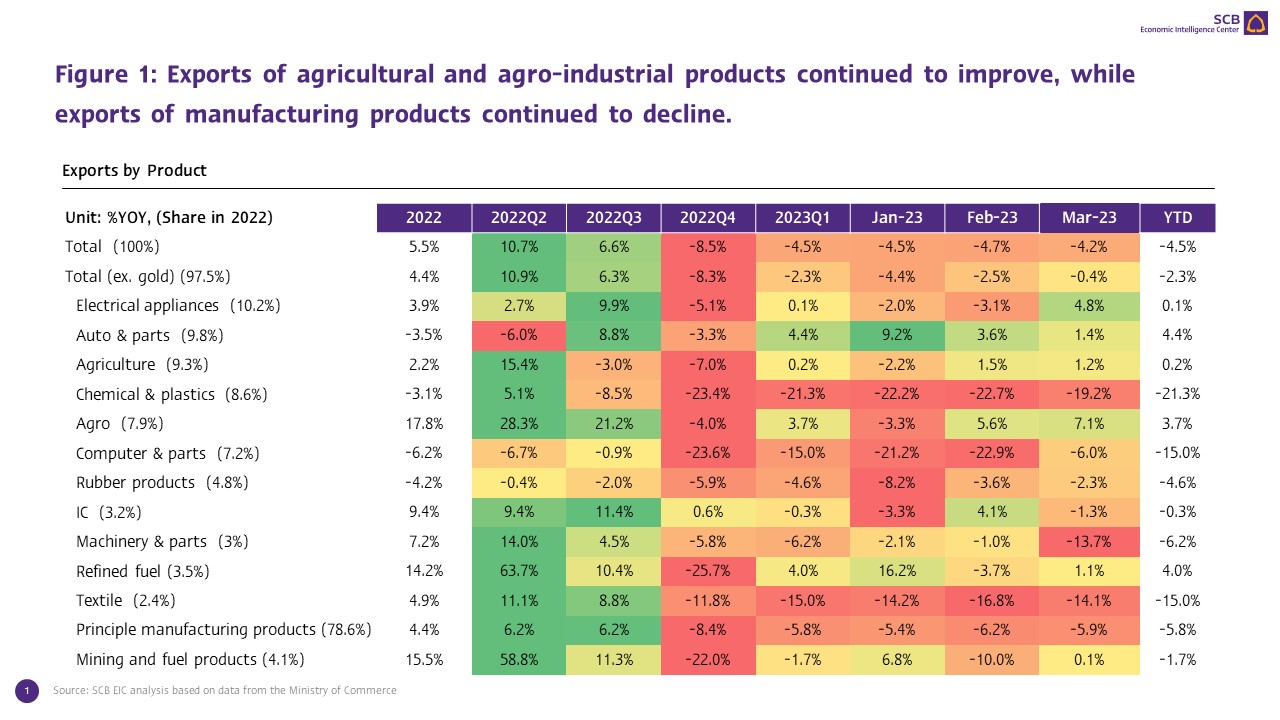
Exports of agricultural and agro-industrial products continued to improve. Meanwhile, exports of principle manufacturing products continued to contract for the sixth month.
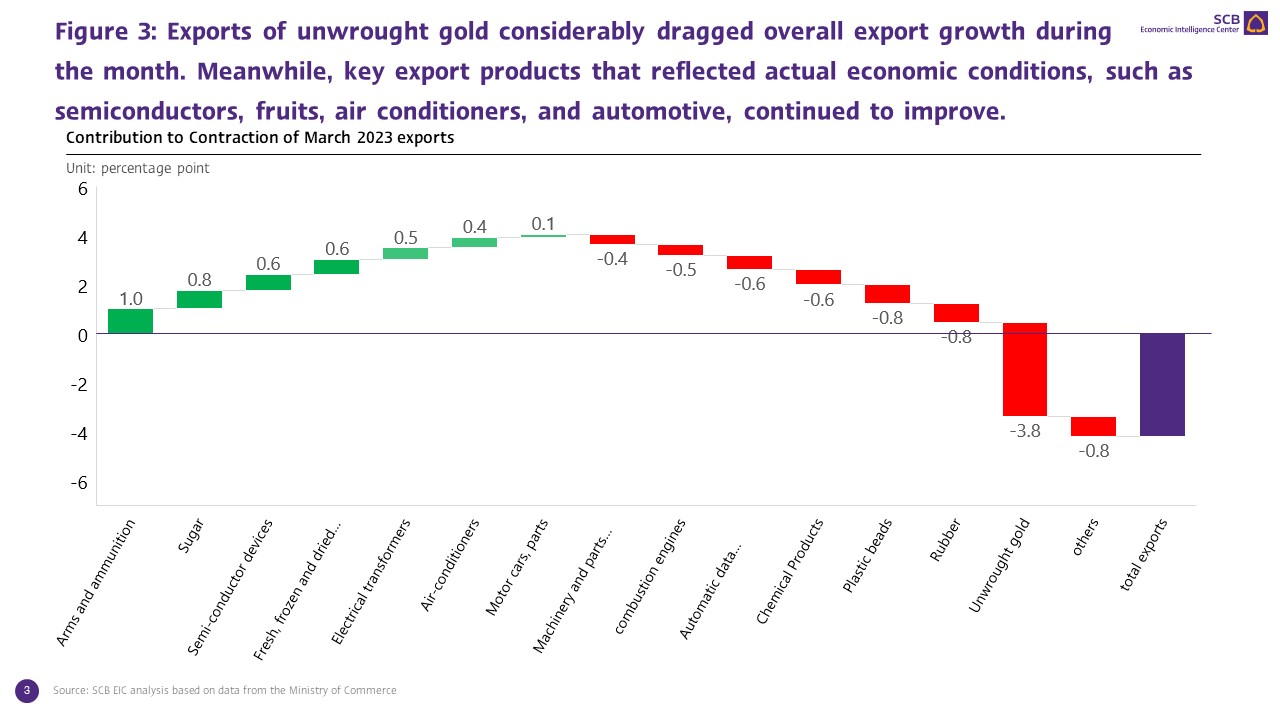
Exports of major products continued to improve in March, in which (1) Exports of agricultural products expanded by 1.2%, marking a 2 consecutive months increase, led by exports of fresh / frozen/ and dried fruits with a 94.5%YOY expansion continuing from 95.0% in the prior month as demand from China, a major import market, recovered in tandem with aid from the low base. Other notable drivers included exports of Chilled or frozen poultry cuts that improved by 47.9%YOY, stalling slightly from 61.6% in the prior month, and exports of rice and tapioca (cassava) products that also continued to improve. (2) Exports of agro-industrial products continued to improve for 2 consecutive months with an expansion of 7.1% compared to 5.6% in the previous month. The key drivers included exports of sugar (up by 73.9% from 21.4% in February) and exports of beverages (up by 13.2%). (3) On the contrary, exports of principle manufacturing products contracted for 6 months straight with a fall at -5.9%, slightly improving from -6.2% in February. Such a weakening growth was prompted by the slump in unwrought gold exports at -41.2%, continuing from -75.3% in the prior month, as well as exports of plastic beads and chemical products that continued to plummet for the ninth and eleventh consecutive month, respectively. Meanwhile, exports of other principle manufacturing products that reflected actual economic conditions, including semiconductor devices, transistors, and diodes, electrical transformers and parts thereof, air conditioners and parts, and motor cars, parts and accessories, continued to improve; and (4) Exports of mining and fuel products slightly improved by 0.1%, after declining by -10.0% in the prior month, as exports of refined fuels returned to an increase at 1.1% compared to -3.7% in February.
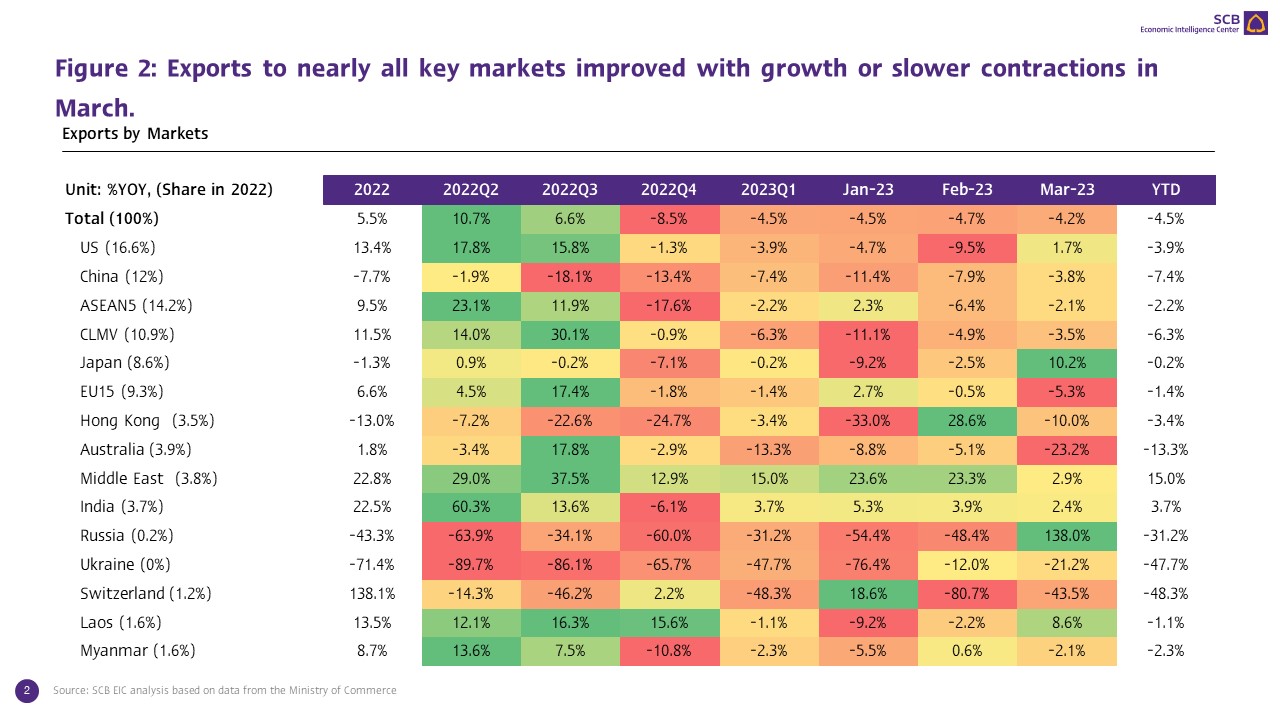
Considering by destination, exports by key markets showed improvements across the board.
Exports to nearly all key trading partners reverted to an expansion or saw less contraction, in which (1) Exports to the US improved by 1.7%, marking the first expansion in 4 months. (2) Similarly, exports to Japan expanded by 10.2%, representing a first expansion in 7 months. (3) Exports to China continued to contract at -3.8%. However, such a contraction was considerably lower than the -7.9% in the prior month. Furthermore, such a performance continued to improve in 9 months, suggesting the continual resumption of Chinese demand after the reopening. (4) Exports to EU28 plummeted by -5.3% compared to -0.5% in the prior month. The decline was led by exports to Switzerland and France, with a plunge at -43.5% and -38.6%, respectively. (5) Exports to ASEAN 5 and CLMV stalled slightly by -2.1% and -3.5%, compared to -6.4% and -4.9% in the prior month, respectively. (6) Exports to the Middle East slowed to 2.9% compared to 23.3% in the prior month, partly due to the high base; and (7) Exports to Russia saw the first expansion in 12 months at 138.0%, making Russia the market with the highest export growth due to the low base.
Thai trade posted a surplus for the first time in a year due to a drastic decline in imports.
The value of imports in March stood at USD 24,935.5 million, plummeting by -7.1%YOY, or dropping compared to the 1.1% growth in the prior month. Excluding gold (a product that does not reflect actual international trade conditions), imports dropped considerably by -7.9%, reflecting slowing import demand. On the contrary, export conditions signaled recovery. As such, the customs basis trade balance registered at a surplus of USD 2,718.8 million in March, marking the first surplus in a year.
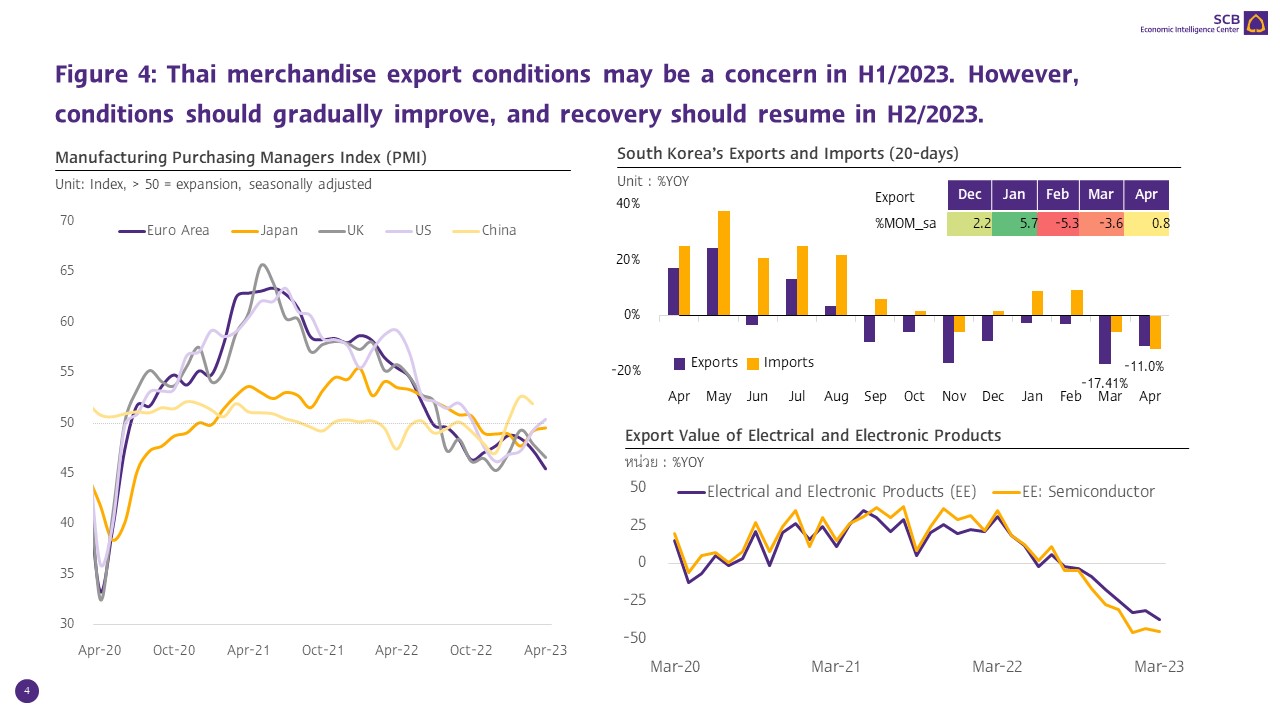
SCB EIC anticipates worrisome Thai merchandise export conditions in H1/2023. However, conditions should gradually improve, and recovery should resume in H2/2023.
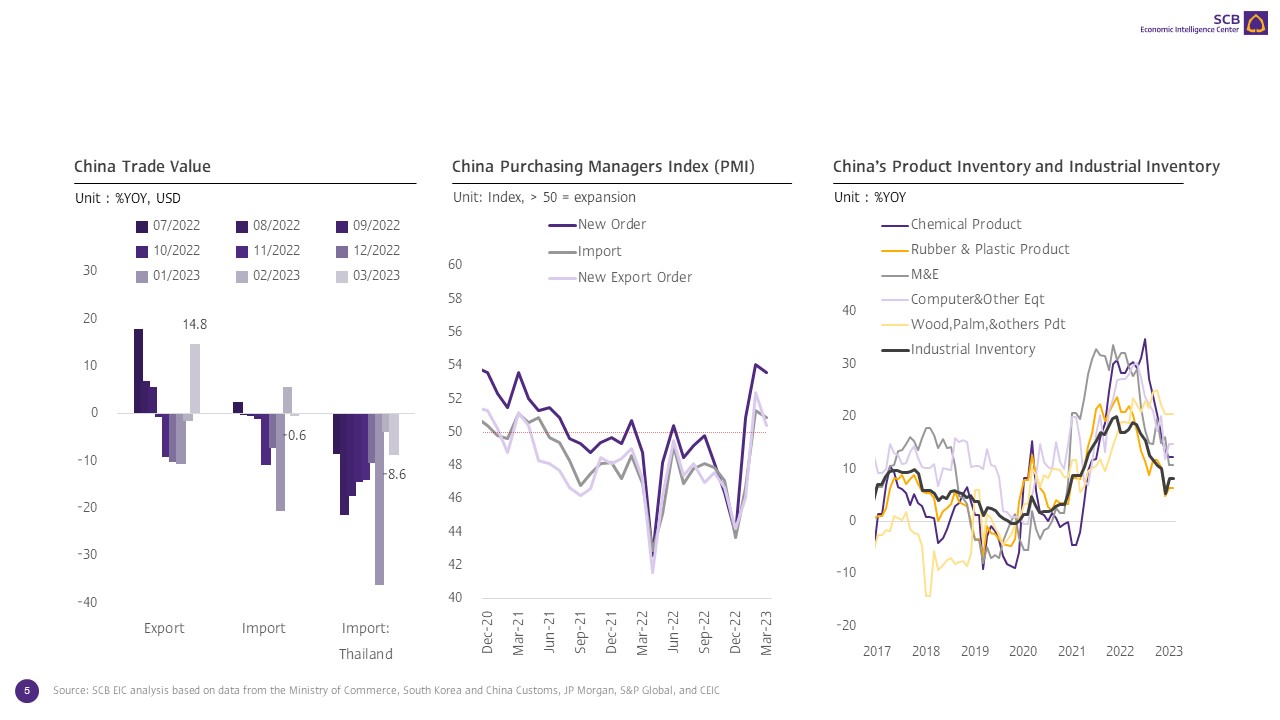
Thai merchandise exports should continue to recover despite anticipations of %YOY contractions in Q2/2023 as global economic conditions should slow in addition to influence from the high base. Despite Thai exports conditions remain vulnerable due to uncertain global economic and trade conditions, signs of recovery started to emerge following (1) The U.S. Flash Manufacturing PMI1 in April that returned to the first expansion in 6 months, partly due to new orders (domestic). Such a performance coincided with Japan’s manufacturing activities, which saw the slowest contraction in 6 months. The decline in sales also improved considerably following better overseas demand. However, the Eurozone’s manufacturing sector remained a concern from the highest contraction observed in 3 years. (2) Better than anticipated Chinese trade conditions in March following the return of a robust export expansion at 14.8%YOY. As such, China’s export during Q1/2023 improved by 0.5%YOY, despite contractions in January and February. In H2/2023, Thai exports to China should revert to growth following the gradual recovery of Chinese demand, reflected by indicators, such as the new orders index, new export orders index, as well as imports index in Q1/2023 that returned to a first expansion in over 6 months. Similarly, growth of inventories and manufacturing inventories continued to stall; and (3) Fast data from South Korea’s export performance during the first 20 days in April saw a slight contraction from the first quarter at -11.0%YOY. However, exports of key products, such as electrical and electronic products (including semiconductors), saw worsening contractions, reflecting drastically slower global demand. Such a condition could undermine Thailand’s electrical and electronic product exports and severely hamper Thai exports, as the mentioned products account for over one-fourth of Thailand’s total export market share.
Furthermore, the World Trade Organization (WTO) revised up its global trade forecast in 2023 to 1.7%YOY from the previous estimation of 1.0% in October 2022. Such a revision reflected recovering global trade conditions, despite the figure remaining lower than the historical average of 2.6%. Nevertheless, global trade conditions should improve to 3.2% in 2024 following better global economic conditions. Demand from key trading partners, especially countries in Asia (including China), should increase by 2.6% compared to the -0.4% contraction in the prior year. Meanwhile, import demand from North America and Europe should drop slightly by -0.1 and -0.6%, respectively. With such regards, Thai merchandise export conditions may be a concern in H1/2023. However, conditions should gradually improve, and recovery should resume in H2/2023. Moreover, the Ministry of Commerce maintains its Thai export growth forecast in the range of 1-2% in 2023.
1Early estimates of the PMI index is based on approximately 85% to 90% of total PMI survey responses each month.